Coty Inc. reports third quarter fiscal 2018 results

SHARE WITH :
Financial IMAGES
- Positive Net Revenue Performance
- Strong Growth in Reported and Adjusted Operating Profit
Coty Inc. (NYSE: COTY) today announced financial results for the third quarter of fiscal year 2018, ended March 31, 2018.

* As compared to combined Coty and P&G Beauty Business net revenues (herein defined as “Combined Company”). These measures, as well as “free cash flow,” are Non-GAAP Financial Measures. Refer to “Basis of Presentation” and “Non-GAAP Financial Measures” for a discussion of these measures. Net Income represents Net Income Attributable to Coty Inc. Reconciliations from reported to adjusted results can be found at the end of this release. Combined Company year-over-year change in net revenues is presented giving effect to the completion of the acquisition of the P&G Beauty Business (the "Merger"), as if the Merger had occurred as of July 1, 2016
Third Quarter Fiscal 2018 Summary
- Net revenues of $2,222.7 million increased 9.4% as reported compared to the prior year and increased 3.4% at constant currency
- Excluding the contribution from the acquisitions of Burberry and one month of Younique, organic net revenues increased 0.2% on a constant currency basis
- Reported operating income of $19.9 million increased from a loss of $(192.5) million
- Adjusted operating income of $227.8 million increased 9.4% from $208.3 million
- Reported net loss of $(77.0) million decreased from $(164.2) million, and adjusted net income of $96.2 million decreased from $110.3 million
- Reported earnings per diluted share of $(0.10) increased from $(0.22) and adjusted earnings per diluted share of $0.13 decreased from $0.15
- Net cash from operating activities was $(118.9) million compared to $43.3 million in the prior year
Nine Months Fiscal 2018 Summary
- Net revenues of $7,098.6 million increased 31.2% as reported compared to the prior year net revenues, and increased 6.3% for the combined company at constant currency
- Excluding the contribution from the acquisitions of Burberry, seven months of Younique and five months of ghd, organic net revenues increased 0.3% on a constant currency basis
- Reported operating income of $223.0 million increased from $(158.8) million
- Adjusted operating income of $770.4 million increased from $682.7 million
- Reported net income of $12.5 million increased from $(117.4) million, and adjusted net income of $409.7 million was in line with the prior period of $411.9 million
- Reported earnings per diluted share of $0.02 increased from $(0.19), and adjusted earnings per diluted share of $0.54 decreased from $0.67
- Net cash provided by operating activities was $188.9 million compared to $706.7 million in the prior year
Commenting on Coty's performance, Camillo Pane, Coty CEO said:
"Our results were generally in line with our expectations, as we delivered steady performance with modest positive organic top line growth and healthy adjusted operating profit improvement. The Luxury division continued to deliver very strong results, while our Professional Beauty division once again demonstrated consistent solid growth. The Consumer Beauty division continued its uneven performance, but with encouraging signs of stability.
We continued to reshape our growth profile by strengthening our iconic global brands, supported by recent relaunches. We are also fueling smaller brands with high growth potential and stabilizing the remaining portfolio including the conclusion of our previously communicated portfolio rationalization program. This streamlining of our portfolio is an important milestone that will allow us to focus on those brands where we believe we are particularly suited to drive long term revenue growth.
Though there is still much work to be done, including the continued integration of the P&G Beauty business, I am encouraged by how far we have come since embarking on our journey to transform Coty into a challenger in the global beauty industry.
As we have said, recovery will not be a straight line, but we continue to aim to deliver modest organic net revenue growth for the second half of the year. For adjusted operating margin, we continue to aim for a healthy improvement in the second half of the year versus the prior year, with most of the impact coming in Q4, as we continue to deliver on our merger synergies."
Basis of Presentation
To supplement financial results presented in accordance with GAAP, certain financial information is presented in this release using the non-GAAP financial measures described in this section. The term “combined company” describes net revenues of Coty Inc. and the P&G Beauty Business giving effect to the Merger for purposes of the nine months ended March 31, 2018, as compared to the nine months ended March 31, 2017, as if it had occurred on July 1, 2016. Combined company period-over-period and combined company constant currency period-over-period do not include any adjustments related to potential profit improvements, potential cost savings or adjustments to fully conform to the accounting policies of Coty. "Constant currency” describes net revenues excluding the effect of foreign currency exchange translations. The term “adjusted” primarily excludes the impact of restructuring and business realignment costs, amortization, costs related to acquisition activities, and certain interest expense and other (income) expense items to the extent applicable. Refer to “Non-GAAP Financial Measures” below for additional discussion of these measures as well as the definition of free cash flow.
Net revenues for the three months ended March 31, 2018, as compared to three months ended March 31, 2017, are reported by segment and geographic region and are presented on a reported (GAAP) and a constant currency basis. Net revenues for the nine months ended March 31, 2018, as compared to nine months ended March 31, 2017, are reported by segment and geographic region and are presented on a reported (GAAP), combined company and combined company constant currency basis. Certain percentages may not agree to the tables due to rounding. Operating income is reported by segment. All changes in margin percentage are described in basis points rounded to the nearest tenth of a percent.
Operating income, net income, operating income margin, gross margin, effective tax rate, and earnings per diluted share (EPS (diluted)) are presented on a reported (GAAP) basis and an adjusted (non-GAAP) basis. Adjusted EPS (diluted) is a performance measure and should not be construed as a measure of liquidity. Net revenues on a constant currency basis, net revenues on a combined company basis, net revenues on a combined company constant currency basis, adjusted operating income, adjusted operating income on a constant currency basis, adjusted operating income margin, adjusted effective tax rate, adjusted net income, adjusted gross margin, adjusted EPS (diluted) and free cash flow are non-GAAP financial measures. Refer to "Non-GAAP Financial Measures" below for additional discussion of these measures. A reconciliation between GAAP and non-GAAP results can be found in the tables and footnotes at the end of this release.
To the extent that Coty provides guidance, it does so only on a non-GAAP basis and does not provide reconciliations of such forward-looking non-GAAP measures to GAAP due to the inherent difficulty in forecasting and quantifying certain amounts that are necessary for such reconciliation, including adjustments that could be made for restructuring, integration and acquisition-related expenses, amortization expenses, adjustments to inventory, and other charges reflected in our reconciliation of historic numbers, the amount of which, based on historical experience, could be significant.
Third Quarter Fiscal 2018 Summary Operating Review
Net revenues of $2,222.7 million increased 9.4% as reported compared to the prior year and increased 3.4% on a constant currency basis. The 3.4% constant currency net revenue growth reflected a 3.2% contribution from Burberry Beauty and one month of Younique, and 0.2% increase in organic net revenue growth, which includes two months of Younique. Organic net revenue growth was driven by strong performance in Luxury and steady momentum in Professional Beauty, partially offset by a decline in Consumer Beauty.
Gross margin of 63.4% increased significantly from 59.8% in the prior year, while adjusted gross margin increased 100bps to 64.3% from 63.3% with strength in all three divisions and mainly due to the realization of benefits from our synergy program.
Reported operating income increased to $19.9 million from a loss of $(192.5) million, primarily due to higher gross profit and lower acquisition costs.
Adjusted operating income increased 9.4% to $227.8 million from $208.3 million driven by improved gross margin and tight cost controls, which were partially offset by increased marketing spend to support multiple brand relaunch efforts.
Reported effective tax rate was (7.9)% compared to 36.9%.
Adjusted effective tax rate was 23.8% compared to 22.2%.
Reported net loss decreased to $(77.0) million from $(164.2) million, primarily due to higher operating income partially offset by higher interest and tax expense.
Adjusted net income of $96.2 million decreased from $110.3 million, reflecting increased interest and redeemable non-controlling interest expense, partially offset by higher adjusted operating income.
Cash Flows
- Net cash from operating activities in the quarter was $(118.9) million, compared to $43.3 million in the prior year, driven by higher working capital requirements due, in part, to the Burberry Beauty acquisition and build-up of inventory in preparation for consolidation of certain distribution centers.
- Negative free cash flow of $(205.4) million in the quarter compared to $(82.5) million in the prior year reflects higher cash used in operating activities partially offset by lower capital expenditures.
- On March 15, 2018, the Company paid a quarterly dividend of $0.125 per share for a total of $93.8 million.
- Cash and cash equivalents of $460.8 million decreased by $74.6 million compared to June 30, 2017.
Total debt of $7,931.2 million increased by $715.6 million while net debt of $7,470.4 million increased by $790.2 million from the balance on June 30, 2017 driven in part by the acquisition of the Burberry Beauty business.
Third Quarter Fiscal 2018 Business Review by Segment
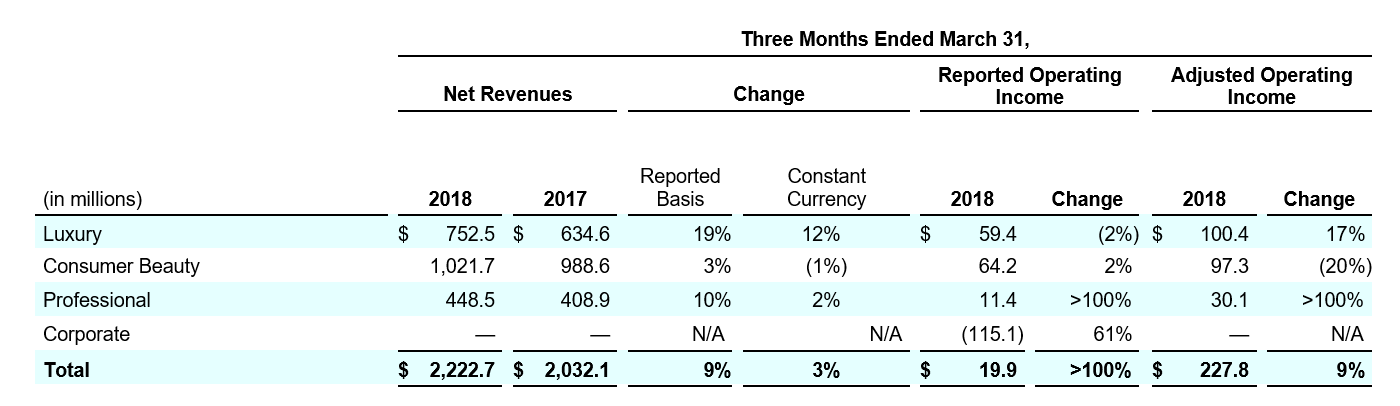
Luxury
- Reported net revenues of $752.5 million increased 18.6% compared to the prior year and 11.8% on a constant currency basis. The increase in constant currency reflects 6.1% organic growth driven by the on-going success of Tiffany & Co. and Gucci Bloom fragrances as well as CK One and Chloe Nomade, and a 5.7% contribution from Burberry.
- Adjusted operating income of $100.4 million increased 16.6% from $86.1 million in the prior year.
Consumer Beauty
- Net revenues of $1,021.7 million increased 3.3% compared to the prior year and decreased (1.2)% on a constant currency basis. The decrease in constant currency reflects a (4.4)% decline in organic growth, which includes two months of Younique. The decline in our organic net revenue growth was driven by certain U.S. brands not yet fully benefiting from relaunch efforts and the impact of pricing actions to improve profitability in our Brazil business, partially offset by growth in the rest of ALMEA.
- Adjusted operating income decreased 19.9% to $97.3 million from $121.5 million in the prior year.
Professional
- Net revenues of $448.5 million increased 9.7% compared to the prior year and 1.9% on a constant currency basis. The 1.9% growth in the underlying business reflects higher net revenues from OPI due to on-going success of the gel restage as well as strength in lacquers. Wella Professionals also continues to benefit from the successful Wellaplex product launch.
- Adjusted operating income increased >100% to $30.1 million from $0.7 million in the prior year
Third Quarter Fiscal 2018 Business Review by Geographic Region
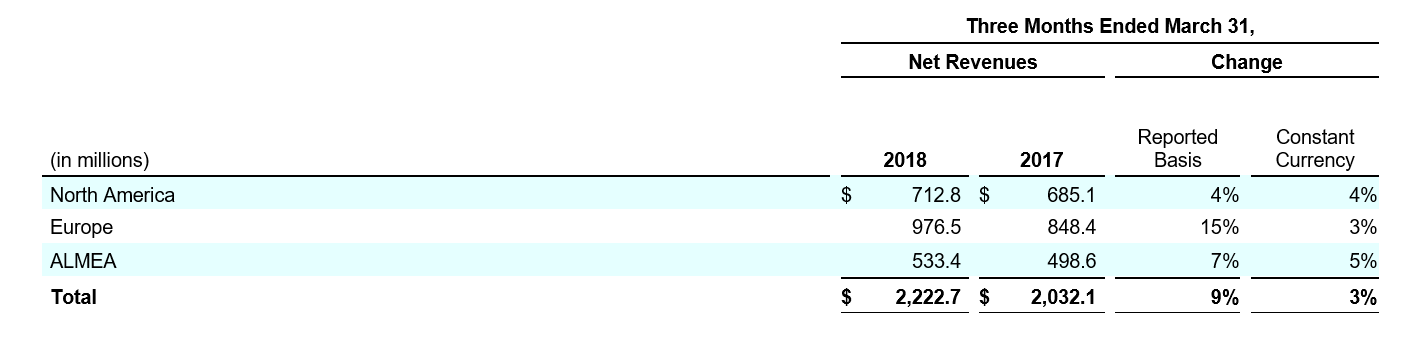
North America
- Reported net revenues increased 4.0% compared to the prior year and increased 3.5% on a constant currency basis, driven primarily by the contributions from Younique and Burberry, the on-going success of Tiffany & Co. and Gucci Bloom and certain mass fragrances, partially offset by declines in U.S. color cosmetics. OPI was also a contributor.
Europe
- Reported net revenues increased 15.1% compared to the prior year and increased 2.7% on a constant currency basis driven primarily by incremental revenues from the success of fragrances including Tiffany & Co. and Gucci Bloom as well as Max Factor.
ALMEA
- Reported net revenues increased 7.0% compared to the prior year and increased 4.8% on a constant currency basis reflecting incremental revenues from fragrances driven by the launches of Tiffany & Co. and Gucci Bloom, and higher revenues from color cosmetics driven by Max Factor in China, partially offset by lower revenues in Brazil.
Noteworthy Company Developments
Other noteworthy company developments include:
- On April 5, 2018, Coty completed its previously announced offering of three series of U.S. dollar denominated and euro denominated senior unsecured notes in an aggregate principal amount of $550 million and €800 million, in a private offering.
- On April 5, 2018, Coty entered into a credit agreement which amended and restated the existing credit agreements. The credit agreement provides for senior secured credit facilities comprised of (i) a five year revolving credit facility in an aggregate principal amount up to $3.25 billion, (ii) a five year term loan A facility consisting of (a) $1.0 billion denominated in U.S. dollars and (b) €2.035 billion denominated in Euros and (iii) a seven year term loan B facility consisting of (a) $1.4 billion denominated in U.S. dollars and (b) €850 million denominated in Euros.
- On April 25, 2018, Coty announced the appointment of Esra Erkal-Paler as Chief Global Corporate Affairs Officer and member of the Executive Committee.
- On May 9, 2018, Coty announced a dividend of $0.125 per share, payable June 14, 2018 to holders of record on May 31, 2018.
- After the quarter close, Coty has completed the previously announced portfolio rationalization program.
Conference Call
Coty Inc. will host a conference call at 8:00 a.m. (ET) today, May 9, 2018 to discuss its results. The dial-in number for the call is (855) 889-8783 in the U.S. or (720) 634-2929 internationally (conference passcode number: 8276807). The call will also be webcast live at http://investors.coty.com. The conference call will be available for replay. The replay dial-in number is (855) 859-2056 in the U.S. or (404) 537-3406 outside the U.S. (conference passcode number: 8276807).
About Coty Inc.
Coty is one of the world’s largest beauty companies with approximately $9 billion in pro forma revenue, an iconic portfolio of brands and a purpose to celebrate and liberate the diversity of consumers’ beauty. We believe the beauty of humanity lies in the individuality of its people; beauty is at its best when authentic; and beauty should make you feel happy, never sad. As the global leader in fragrance, a strong number two in professional salon hair color & styling, and number three in color cosmetics, Coty operates three divisions: Consumer Beauty, which is focused on mass color cosmetics, mass retail hair coloring and styling products, body care and mass fragrances with brands such as COVERGIRL, Max Factor and Rimmel; Luxury, which is focused on prestige fragrances and skincare with brands such as Calvin Klein, Burberry, Marc Jacobs, Hugo Boss, Gucci and philosophy; and Professional Beauty, which is focused on servicing salon owners and professionals in both hair and nail, with brands such as Wella Professionals, Sebastian Professional, OPI and ghd. Coty has over 20,000 colleagues globally and its products are sold in over 150 countries. Coty and its brands are committed to a range of social causes as well as seeking to minimize its impact on the environment.
For additional information about Coty Inc., please visit www.coty.com.
Forward Looking Statements
Certain statements in this release are “forward-looking statements” within the meaning of the Private Securities Litigation Reform Act of 1995. These forward-looking statements reflect the Company’s current views with respect to, among other things, establishing the Company as a global leader and challenger in beauty, the Company’s future operations and financial performance (including brand relaunches, revenue and profit trends, and any outlook for the remainder of the fiscal year and future reporting periods), synergies from, performance of and integration of (including costs associated therewith) the Company’s recent acquisitions (including the P&G Beauty business), ongoing and future cost-efficiency initiatives and the timing, presentation and cost of future cost saving and/or restructuring plans, strategic transactions (including mergers and acquisitions, joint ventures, divestitures, licenses and portfolio rationalizations), future liquidity, future performance in digital and e-commerce, future performance of the Company’s key brands and the Company’s Consumer Beauty division, dividends, and fiscal year and subsequent effective tax rates (including the future impact of the Tax Act). These forward-looking statements are generally identified by words or phrases, such as “anticipate”, “are going to”, “estimate”, “plan”, “project”, “expect”, “believe”, “intend”, “foresee”, “forecast”, “will”, “may”, “should”, “outlook”, “continue”, “target”, “aim”, “potential” and similar words or phrases. These statements are based on certain assumptions and estimates that the Company considers reasonable, but are subject to a number of risks and uncertainties, many of which are beyond the Company’s control, which could cause actual events or results (including its financial condition, results of operations, cash flows and prospects) to differ materially from such statements, including:
- the Company’s ability to achieve its global business strategies, compete effectively in the beauty industry and achieve the benefits contemplated by its strategic initiatives (including sell-through of its relaunched brands and reduction in discounts in certain markets) within the expected time frame or at all;
- the Company’s ability to anticipate, gauge and respond to market trends and consumer preferences, which may change rapidly, and the market acceptance of new products, including any relaunched or rebranded products, execution of new launches, and the anticipated costs and discounting associated with such relaunches and rebrands;
- use of estimates and assumptions in preparing the Company’s financial statements, including with regard to revenue recognition, stock compensation expense, income taxes, purchase price allocations, the assessment of goodwill, other intangible assets and long-lived assets for impairment, the market value of inventory, pension expense and the fair value of acquired assets and liabilities associated with acquisitions;
- managerial, integration, operational, regulatory, legal and financial risks, including diversion of management attention to and management of, cash flows, and expenses and costs (including operating costs and capital expenses) associated with multiple strategic initiatives and internal reorganizations, including current and future business realignment or restructuring activities;
- the continued integration of the P&G Beauty Business and other recent acquisitions with the Company’s business, operations, systems, financial data and culture and the ability to realize synergies, reduce costs and realize other potential efficiencies and benefits (including through the Company’s restructuring and business realignment programs to simplify processes and improve organizational agility) at the levels and at the costs and within the time frames currently contemplated or at all;
- increased competition, consolidation among retailers, shifts in consumers’ preferred distribution and marketing channels (including to digital and luxury channels), shelf-space resets, compression of go-to-market cycles, changes in product and marketing requirements by retailers, and other changes in the retail, e-commerce and wholesale environment in which the Company does business and sell its products;
- changes in law (including the Tax Act), regulations and policies and/or the enforcement thereof that affect its business, financial performance, operations or its products;
- the Company and its business partners' and licensors' abilities to obtain, maintain and protect the intellectual property used in its and their respective businesses, protect its and their respective reputations (including those of its and their executives), public goodwill, and defend claims by third parties for infringement of intellectual property rights;
- the effect of the divestiture and discontinuation of the Company’s non-core brands (including associated post-closing cost reduction programs) and rationalizing wholesale distribution by reducing the amount of product diversion to the value and mass channels;
- any unanticipated problems, liabilities or other challenges associated with an acquired business which could result in increased risk or new, unanticipated or unknown liabilities, including with respect to environmental, competition and other regulatory, compliance or legal matters;
- the Company’s international operations and joint ventures, including enforceability and effectiveness of its joint venture agreements and reputational, compliance, regulatory, economic and foreign political risks, including difficulties and costs associated with maintaining compliance with a broad variety of complex domestic and international regulations;
- the Company’s dependence on certain licenses (especially in its Luxury division), entities performing outsourced functions and third-party suppliers, including third party software providers;
- administrative, development and other difficulties in meeting the expected timing of market expansions, product launches and marketing efforts;
- global political and/or economic uncertainties, disruptions or major regulatory changes, including the impact of Brexit, the current U.S. administration and recent changes in tariffs and other international trade regulations and the U.S. tax code;
- the number, type, outcomes (by judgment, order or settlement) and costs of legal, compliance, tax, regulatory or administrative proceedings, and/or litigation;
- the Company’s ability to manage seasonal and other variability and to anticipate future business trends and needs;
- disruptions in operations, including due to disruptions in supply chain, restructurings and other business realignment activities, manufacturing or information technology systems, labor disputes, and natural disasters;
- restrictions imposed on the Company through its license agreements, credit facilities and senior unsecured bonds, its ability to refinance or recapitalize debt, and changes in the manner in which the Company finances its debt and future capital needs, including potential acquisitions;
- increasing dependency on information technology and the Company’s ability to protect against service interruptions, data corruption, cyber-based attacks or network security breaches, costs and timing of implementation and effectiveness of any upgrades or other changes to information technology systems, and its failure to comply with any privacy or data security laws (including the EU General Data Protection Regulation) or to protect against theft of customer, employee and corporate sensitive information;
- the Company’s ability to attract and retain key personnel, including during times of integration, transition and restructurings;
- the distribution and sale by third parties of counterfeit and/or gray market versions of the Company’s products; and
- other factors described elsewhere in this document and from time to time in documents that the Company file with the SEC.
When used herein, the term “includes” and “including” means, unless the context otherwise indicates, “including without limitation”. More information about potential risks and uncertainties that could affect the Company’s business and financial results is included under the heading “Risk Factors” and “Management’s Discussion and Analysis of Financial Condition and Results of Operations” in the Company’s Annual Report on Form 10-K for the fiscal year ended June 30, 2017 and other periodic reports the Company has filed and may file with the SEC from time to time.
All forward-looking statements made in this release are qualified by these cautionary statements. These forward-looking statements are made only as of the date of this release, and the Company does not undertake any obligation, other than as may be required by law, to update or revise any forward-looking or cautionary statements to reflect changes in assumptions, the occurrence of events, unanticipated or otherwise, or changes in future operating results over time or otherwise.
Comparisons of results for current and any prior periods are not intended to express any future trends or indications of future performance unless expressed as such, and should only be viewed as historical data.
Non-GAAP Financial Measures
The Company operates on a global basis, with the majority of net revenues generated outside of the U.S.
Accordingly, fluctuations in foreign currency exchange rates can affect results of operations. Therefore, to supplement financial results presented in accordance with GAAP, certain financial information is presented excluding the impact of foreign currency exchange translations to provide a framework for assessing how the underlying businesses performed excluding the impact of foreign currency exchange translations (“constant currency”). Constant currency information compares results between periods as if exchange rates had remained constant period-over-period, with the current period’s results calculated at the prior-year period’s rates. The Company calculates constant currency information by translating current and prior-period results for entities reporting in currencies other than U.S. dollars into U.S. dollars using constant foreign currency exchange rates. The constant currency calculations do not adjust for the impact of revaluing specific transactions denominated in a currency that is different to the functional currency of that entity when exchange rates fluctuate. The constant currency information presented may not be comparable to similarly titled measures reported by other companies. The Company discloses the following constant currency financial measures: net revenues, combined company net revenues, gross profit and adjusted operating income.
The Company presents period-over-period comparisons of net revenues on a constant currency basis, on a combined company, combined company constant currency, and combined company constant currency excluding the impact of acquisitions other than the acquisition of the P&G Beauty Business ("combined company organic (LFL)") basis. The Company believes that combined company period-over-period and combined company constant currency period-over-period better enable management and investors to analyze and compare the Company's net revenues performance from period to period, as the total business and individual divisions are being managed on a combined company basis. In the periods described in this release, combined company period-over-period and combined company constant currency period-over-period give effect to the completion of the Merger for purposes of the nine months ended March 31, 2018, as compared to the nine months ended March 31, 2017, as if it has been completed on July 1, 2016. Combined company growth and combined company constant currency growth do not include any adjustments related to potential profit improvements, potential cost savings or adjustments to fully conform to the accounting policies of Coty. For a reconciliation of combined company period-over-period, combined company constant currency period-over-period, and combined company organic (LFL) period-over-period, see the table entitled “Reconciliation of Reported Net Revenues to Combined Company and Like-For-Like Net Revenues”. For a reconciliation of the Company's combined company period-over-period, combined company constant currency period-over-period and combined company organic (LFL) by segment and geographic region, see the tables entitled “Net Revenues and Adjusted Operating Income by Segment” and “Net Revenues by Geographic Regions."
The Company presents operating income, operating income margin, gross profit, gross margin, effective tax rate, net income, net income margin, net revenues and EPS (diluted) on a non-GAAP basis and specifies that these measures are non-GAAP by using the term “adjusted”. The Company believes these non-GAAP financial measures better enable management and investors to analyze and compare operating performance from period to period. In calculating adjusted operating income, operating income margin, gross profit, gross margin, effective tax rate, net income, net income margin and EPS (diluted), the Company excludes the following items:
- Costs related to acquisition activities: The Company excludes acquisition-related costs and acquisition accounting impacts such as those related to transaction costs and costs associated with the revaluation of acquired inventory in connection with business combinations because these costs are unique to each transaction. The nature and amount of such costs vary significantly based on the size and timing of the acquisitions and the maturities of the businesses being acquired. Also, the size, complexity and/or volume of past acquisitions, which often drives the magnitude of such expenses, may not be indicative of the size, complexity and/or volume of any future acquisitions.
- Restructuring and other business realignment costs: The Company excludes costs associated with restructuring and business structure realignment programs to allow for comparable financial results to historical operations and forward-looking guidance. In addition, the nature and amount of such charges vary significantly based on the size and timing of the programs. By excluding the above referenced expenses from the non-GAAP financial measures, management is able to evaluate the Company’s ability to utilize existing assets and estimate their long-term value. Furthermore, management believes that the adjustment of these items supplement the GAAP information with a measure that can be used to assess the sustainability of the Company’s operating performance.
- Amortization expense: The Company excludes the impact of amortization of finite-lived intangible assets, as such non-cash amounts are inconsistent in amount and frequency and are significantly impacted by the timing and/or size of acquisitions. Management believes that the adjustment of these items supplement the GAAP information with a measure that can be used to assess the sustainability of the Company’s operating performance. Although the Company excludes amortization of intangible assets from the non-GAAP expenses, management believes that it is important for investors to understand that such intangible assets contribute to revenue generation. Amortization of intangible assets that relate to past acquisitions will recur in future periods until such intangible assets have been fully amortized. Any future acquisitions may result in the amortization of additional intangible assets.
- Interest and other (income) expense: The Company excludes foreign currency impacts associated with acquisition-related and debt financing related forward contracts as the nature and amount of such charges are not consistent and are significantly impacted by the timing and size of such transactions.
- Noncontrolling interest: This adjustment represents the after-tax impact of the non-GAAP adjustments included in Net income attributable to noncontrolling interests based on the relevant non-controlling interest percentage.
- Tax: This adjustment represents the impact of the tax effect of the pretax items excluded from Adjusted net income. The tax impact of the non-GAAP adjustments are based on the tax rates related to the jurisdiction in which the adjusted items are received or incurred.
The Company has provided a quantitative reconciliation of the difference between the non-GAAP financial measures and the financial measures calculated and reported in accordance with GAAP. For a reconciliation of adjusted gross profit to gross profit, adjusted EPS (diluted) to EPS (diluted), and adjusted net revenues to net revenues, see the table entitled “Reconciliation of Reported to Adjusted Results for the Consolidated Statements of Operations.” For a reconciliation of adjusted operating income to operating income and adjusted operating income margin to operating income margin, see the tables entitled “Reconciliation of Reported Operating Income to Adjusted Operating Income” and "Reconciliation of Reported Operating Income to Adjusted Operating Income by Segment." For a reconciliation of adjusted effective tax rate and adjusted cash tax rate to effective tax rate, see the table entitled “Reconciliation of Reported Income (Loss) Before Income Taxes and Effective Tax Rates to Adjusted Income Before Income Taxes, Effective Tax Rates and Cash Tax Rates.” For a reconciliation of adjusted net income and adjusted net income margin to net income, see the table entitled “Reconciliation of Reported Net Income to Adjusted Net Income.”
The Company also presents free cash flow. Free cash flow is defined as net cash provided by operating activities, less capital expenditures. Management believes that free cash flow is useful for investors because it provides them with an important perspective on the cash available for debt repayment and other strategic measures, after making necessary capital investments in property and equipment to support the Company's ongoing business operations, and provides them with the same measures that management uses as the basis for making resource allocation decisions. For a reconciliation of Free Cash Flow, see the table entitled “Reconciliation of Net Cash Provided by Operating Activities to Free Cash Flow.”
These non-GAAP measures should not be considered in isolation, or as a substitute for, or superior to, financial measures calculated in accordance with GAAP.
Additional Tables
Click here for Additional Tables.
For more information contact :
Investor Relations
Kevin Monaco, +1-212-389-6815
Media
Jennifer Friedman, +1-917-754-8399