Coty Inc. reports first quarter fiscal 2019 results

SHARE WITH :
Financial IMAGES
- Coty Inc. Reports First Quarter Fiscal 2019 Results
- First Quarter Results Impacted by Supply Chain Disruptions
- EPS Growth Supported by Fixed Cost Improvement and Favorable Tax Impact
NEW YORK - November 7, 2018 -- Coty Inc. (NYSE: COTY) today announced financial results for the first quarter of fiscal year 2019, ended September 30, 2018.
Highlights
Revenues:
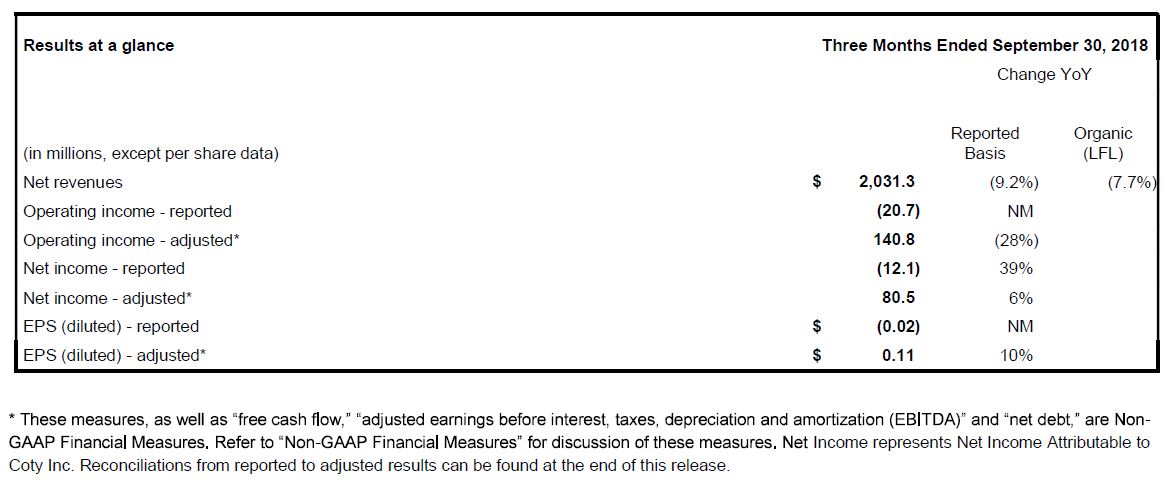
- 1Q19 reported net revenues of $2,031.3 million decreased 9.2%, with a like-for-like (LFL) revenue decline of 7.7% as we encountered several temporary supply chain-related headwinds. We estimate these factors cumulatively negatively impacted LFL by approximately 5%, implying an underlying 1Q19 decline in the low single digits, with underlying declines limited to the Consumer Beauty division.
- Specific supply chain headwinds included:
- Warehouse and planning center consolidation disruptions in Europe and the U.S., which impacted all three divisions;
- Component shortages from certain external suppliers, which impacted Luxury; and
- The U.S. Hurricane Florence in the second half of September, which significantly impacted our manufacturing plant and distribution center in North Carolina, which primarily impacted the Luxury division.
Gross Margin
- 1Q19 reported gross margin of 60.2% decreased by 70 bps from the prior-year period, while the adjusted gross margin of 60.4% decreased by 120 bps, primarily driven by the impact of supply chain disruptions, including higher freight costs, on both Consumer Beauty and Luxury.
Operating Income:
- 1Q19 reported operating loss of $20.7 million decreased from reported income of $29.5 million.
- 1Q19 adjusted operating income of $140.8 million, down by 28% from the prior year with a margin of 6.9%, which included approximately $60 million of impact from the temporary headwinds discussed above.
- The adjusted operating income decline reflected the net revenue and gross margin contraction, as well as an approximately 3.8% FX headwind, in part offset by significant progress in fixed cost reduction versus the prior year as we delivered on our synergy commitments.
Net Income:
- 1Q19 reported net loss of $12.1 million improved from a loss of $19.7 million in the prior-year, while the adjusted net income of $80.5 million grew 6% from $76.3 million in the prior year, primarily due to a $32 million tax benefit in the quarter, coupled with lower interest expense, tied to higher EUR borrowings in 1Q19.
Earnings Per Share (EPS):
- Our 1Q19 reported earnings per share of $(0.02) improved from $(0.03) in the prior-year, and the adjusted EPS of $0.11 improved from $0.10 in the prior year. The aforementioned tax benefit contributed $0.04 to EPS.
Operating Cash Flow & Net Debt:
- In 1Q19, net cash provided by operating activities was $(81.9) million, down from $(8.9) million in 1Q18 primarily driven by continued pressures on working capital, largely connected to our supply chain disruptions, as well as an increase in integration and restructuring cash costs of over $15 million to approximately $140 million in 1Q19.
- Our 1Q19 free cash flow of $(215.5) million decreased from $(120.3) million in the prior year, driven primarily by the reduction in operating cash flow.
Net debt of $7,661.3 million on September 30, 2018 increased by $369.7 million from the balance of $7,291.6 million on June 30, 2018, resulting in a last twelve months Net debt to adjusted EBITDA ratio of 5.8x compared with our June 30, 2018 ratio of 5.3x.
Management Comments
Commenting on the financial results, Camillo Pane, Coty CEO said:
"We are very disappointed with the supply chain disruptions that we have experienced over the last quarter and the resulting poor Q1 financial performance. While we had anticipated some level of disruption in the first quarter from warehousing and planning consolidation, the increased scope of the disruptions resulted in much weaker results than previously expected. We have been working to remedy the supply chain issues and expect to temper the headwinds in 2Q19, and have them be substantially resolved in 3Q19, although we do not expect to fully recover the 1Q19 financial impact in the balance of FY19.
As a result of these disruptions, we have decided to modify our distribution center consolidation plan for the remainder of the year to minimize business impact. With a healthy synergy delivery already in 1Q19, these modifications should have no impact to our commitment of $225 million of synergies in FY19 and $750 million total by the end of FY20.
By division, underlying consumer demand in Luxury and Professional Beauty remains strong, and if we exclude the supply chain disruptions, both divisions would have reported solid net revenue growth in 1Q19 consistent with their FY18 trend, driven by strong innovation and excellence in execution. However, Consumer Beauty's underlying high single digit revenue decline clearly reflects category weakness in developed markets, continued competitive pressure and performance challenges with some of our brands, as well as the repercussions of our severe supply chain disruptions on our Consumer Beauty gross-to-net, including customer penalties and increased promotional support. From here, the pathway to stabilization of Consumer Beauty will focus on: 1) strengthening operational discipline, including restoring service levels; 2) actively improving gross-to-net as supply chain headwinds abate; 3) refocusing investment from lower priority to higher-potential brand-country combinations; 4) an increased focus on cost structure to reflect the top-line trajectory; and 5) a more pronounced shift in investments towards new growth channels.
To conclude, 1Q19 was a disappointing setback in achieving our financial targets and strategic goals, and we are working hard to solve the issues. With the P&G Beauty integration near completion, and after we have overcome the internal challenges, we will be better equipped to focus more externally, so that we can fully capitalize on the exciting and dynamic changes in the beauty industry. We remain absolutely convinced that the fast-paced and ambitious transformational agenda we are pursuing, including comprehensive upgrades to our systems, processes, culture, and people, is ultimately building a much stronger Coty for the long term."
Outlook
As we look to the remainder of the year:
- 2Q19: We expect underlying YoY net revenue trends in 2Q19 to improve versus 1Q19 across all three divisions, inclusive of expected supply chain headwinds. We expect Luxury and Professional Beauty to return to LFL net revenue growth in 2Q19, while Consumer Beauty YoY trends should improve to a high single digit decline. On adjusted operating income, we expect 2Q19 adjusted operating income to be moderately lower YoY, driven by remaining supply chain impacts and FX headwinds. The 2Q19 year-over-year adjusted EPS comparison will be pressured by the $42 million positive tax settlement recorded in 2Q18.
- FY19: Despite the supply chain headwinds, we continue to expect operating profit and margin growth in FY19, driven by significant progress in fixed cost reductions and synergy delivery. However, we need some more time to assess the financial impacts of the continuing supply disruptions and, at this stage we are not providing any further guidance, but expect to provide an update on our outlook on the next earnings call.
Deleveraging remains a top priority in FY19 and beyond. We remain committed to our target of achieving a Net Debt to adjusted EBITDA ratio of below 4.0x by the end of calendar 2020 and we expect positive free cash flow in the remaining quarters and in FY19. Our liquidity position is substantial, with significant flexibility from over $2 billion of revolver availability.
First Quarter Fiscal 2019 Business Review by Segment
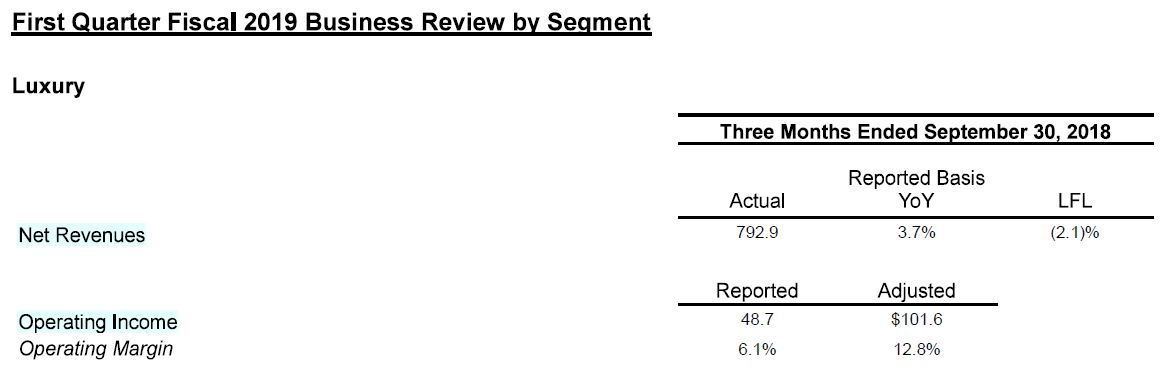
In 1Q19, reported Luxury net revenues of $792.9 million increased by 3.7% versus the prior year. On a LFL basis, Luxury net revenues declined by 2.1% due to the supply chain impacts referenced above. We estimate that the combination of these factors negatively impacted the Luxury division by approximately 7%, implying mid single digit underlying growth.
Despite these challenges, we continued to see solid in-market momentum, especially for the Gucci, Tiffany, Miu Miu and Chloe brands. Burberry delivered solid results in 1Q19, and will become part of our LFL base in 2Q19. From a regional perspective, we achieved strong growth in emerging markets, in particular in Asia, with solid results in Europe. North America and travel retail were disproportionately impacted by the hurricane and the supply chain disruptions, which drove net revenue declines in both businesses. We expect to fully recover the hurricane-disrupted product shipments in the critical 2Q19 holiday season, with no net sales lost between 1Q19 and 2Q19, and are working hard to address the supply chain headwinds.
The Luxury division delivered reported operating income of $48.7 million, a decline of 14% vs. the prior-year period, while adjusted operating income was $101.6 million, reflecting very strong 13% growth from the prior-year, despite the supply chain impact. The adjusted operating margin was 12.8%, up 100 bps versus 1Q18, fueled by strong fixed cost control and the phasing of marketing investments.
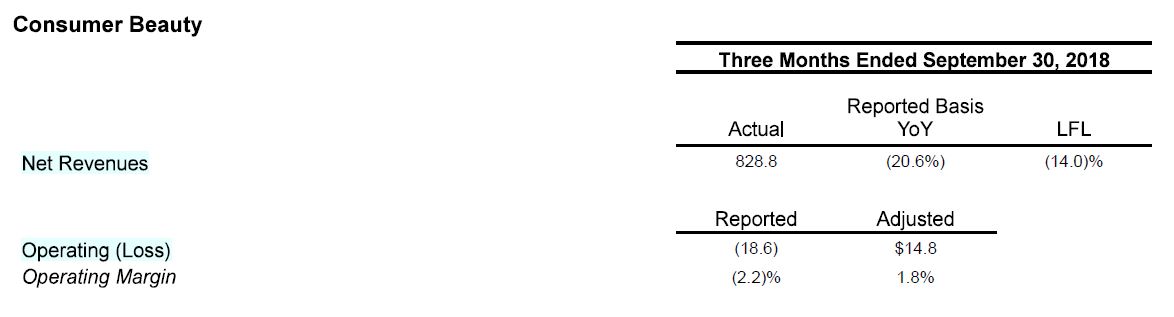
1Q19 Consumer Beauty net revenues of $828.8 million declined 20.6% on a reported basis and declined 14.0% LFL. We estimate that the supply chain disruptions negatively impacted the division by approximately 5%, implying a high single digit underlying decline. The sequential deterioration in Consumer Beauty's business trends reflected the impact of the supply chain disruptions on the division, including customer penalties and increased promotions which reduced net revenues. Top-line was further impacted by the continued weakness in U.S. and Europe mass beauty categories, coupled with previously flagged distribution losses.
While our developed markets deteriorated in the quarter, we saw modest growth in ALMEA supported by high single digit LFL growth in Brazil and the Middle East & Africa, partially offset by a slowdown of our brands in Australia. These results were underpinned by strong share gains in the region, particularly in Brazil.
By category, in retail hair, Wella - our largest Coty brand - drove solid net revenue growth and share gains in a number of key emerging markets, fueled by color and styling products, while Clairol remained under pressure. Our color cosmetics business remained challenged, reflecting the significant impact of supply chain disruptions, resultant increases in promotional activity and market share losses. As part of our plan to revitalize CoverGirl, we are pleased to announce that CoverGirl has become the largest cosmetics brand to be Leaping Bunny certified by Cruelty Free International, which is a significant milestone in our journey to reconnect the CoverGirl brand with consumers and to remain a thought leader in the beauty industry. The majority of CoverGirl's recent innovation delivered strong growth this quarter.
For Younique, while year-over-year sales trends improved sequentially, 1Q19 revenue performance was below the business's long term trajectory as strong presenter sponsorship and growth in gross revenues was more than offset by increased promotional activity and compensation plan adjustments. While these adjustments have not translated into improved presenter retention at the pace initially expected, we firmly believe that traction in the new subscription and loyalty programs, compensation plan refinements and the continued broadening of the Younique product portfolio will support strong momentum in Younique in the coming years.
The reported operating loss in 1Q19 of $18.6 million declined from $61.9 million in the prior year period, and adjusted operating income of $14.8 million declined from $88.3 million in the prior year period, resulting in an adjusted operating margin of 1.8%. The margin pressure was largely driven by the combination of weak top-line results and supply chain disruptions. While the profit performance of the Consumer Beauty division was disappointing, we have benefited, and expect to continue to benefit, from the substantial reduction in our fixed cost base.
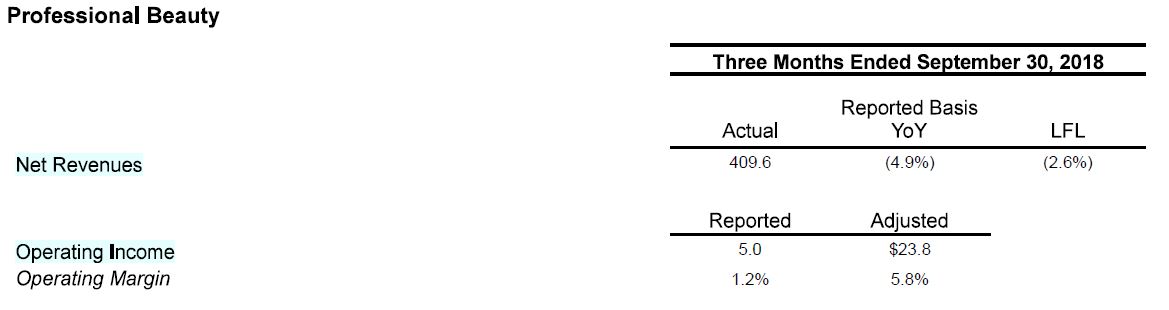
Professional Beauty 1Q19 net revenues of $409.6 million declined by 4.9%, with LFL down 2.6%. The disruption of service levels at our North America distribution center had a significant negative impact on our North America hair and nail businesses. We see no underlying change to the strong customer demand for our brands in North America or to the overall health of our salon professional business. We estimate that the supply chain disruptions negatively impacted revenues by approximately 4%, implying low single digit underlying net revenue growth. We continued to see solid momentum in the rest of the business, led by our largest global brand Wella, with solid growth in Europe and very good growth in ALMEA and in ghd. The strong in market results were also driven by the promising start of key innovations like Wella Koleston Perfect with ME+ and ghd Platinum+ styler.
Professional Beauty reported operating income of $5.0 million improved from a reported loss of $1.7 million in the prior year period, while adjusted operating income grew 41% to $23.8 million. The Professional Beauty adjusted operating margin of 5.8% grew 190 bps, despite the supply chain impacts, driven by mix-led margin benefits and good fixed cost reduction.
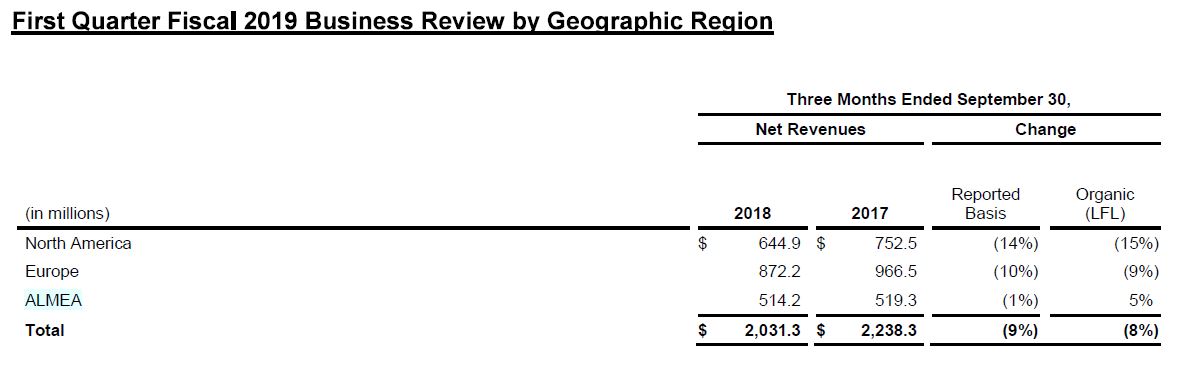
North America
- North America net revenues of $644.9 million, or approximately 32% of total net revenues, decreased 14% as reported and declined 15% LFL reflecting the impact of the U.S. hurricane on our North Carolina facilities, the supply chain disruption in our Professional Beauty distribution center and the continued headwinds in our Consumer Beauty U.S. business including the supply chain disruptions.
Europe
- Europe net revenues of $872.2 million, or approximately 43% of the total, declined 10% on a reported basis and declined 9% on a LFL basis with growth in Luxury and Professional Beauty largely offset by declines in the travel retail channel, driven by supply chain disruptions, and Consumer Beauty, driven by performance challenges and supply chain disruptions.
ALMEA
- ALMEA net revenues of $514.2 million, or approximately 25% of the total, continued to show strong momentum despite impact from the supply chain disruptions. Revenues decreased 1% as reported, but grew 5% LFL fueled by very strong growth in Luxury and Professional Beauty, and modest growth in Consumer Beauty reflecting the return to growth in Brazil and strong performance in Middle East & Africa.
Cash Flows
- In 1Q19, net cash provided by operating activities was $(81.9) million, down from $(8.9) million in 1Q18, primarily driven by continued pressures on working capital in large part connected to our supply chain disruptions as well as an increase of over $15 million in integration and restructuring cash cost outflows.
- Our 1Q19 free cash flow of $(215.5) million decreased from $(120.3) million in the prior year driven by the reduction in operating cash flow.
- In 1Q19, we distributed $(93.8) million in quarterly dividends.
- Cash and cash equivalents of $423.3 million increased from $331.6 million on June 30, 2018. Total debt of $8,084.6 million increased by $461.4 million from June 30, 2018, with net debt of $7,661.3 million up $369.7 million from the balance of $7,291.6 million on June 30, 2018. This net debt increase reflects negative free cash flow of $(215.5) million, the dividend payment of $(93.8) million, and the purchase of the Escada license of $(40.8) million.
Other Company Developments
Other company developments include:
- On November 7, 2018, Coty announced a dividend of $0.125 per share, payable December 14, 2018 to holders of record on November 30, 2018. This dividend will be considered a return of capital.
Conference Call
Coty Inc. will host a conference call at 8:00 a.m. (ET) today, November 7, 2018 to discuss its results. The dial-in number for the call is (866) 834-4311 in the U.S. or (720) 405-2213 internationally (conference passcode number: 2361249). The live audio webcast and presentation slides will be available at http://investors.coty.com. The conference call will be available for replay.
About Coty Inc.
Coty is one of the world’s largest beauty companies with over $9 billion in revenue, an iconic portfolio of brands and a purpose to celebrate and liberate the diversity of consumers’ beauty. We believe the beauty of humanity lies in the individuality of its people; beauty is at its best when authentic; and beauty should make you feel happy, never sad. As the global leader in fragrance, a strong number two in professional salon hair color & styling, and number three in color cosmetics, Coty operates three divisions: Consumer Beauty, which is focused on mass color cosmetics, mass retail hair coloring and styling products, body care and mass fragrances with brands such as COVERGIRL, Max Factor, Bourjois and Rimmel; Luxury, which is focused on prestige fragrances and skincare with brands such as Calvin Klein, Marc Jacobs, Hugo Boss, Gucci and philosophy; and Professional Beauty, which is focused on servicing salon owners and professionals in both hair and nail, with brands such as Wella Professionals, Sebastian Professional, OPI and ghd. Coty has 20,000 colleagues globally and its products are sold in over 150 countries. Coty and its brands are committed to a range of social causes as well as seeking to minimize its impact on the environment.
For additional information about Coty Inc., please visit www.coty.com.
Forward Looking Statements
Certain statements in this Form 10-Q are “forward-looking statements” within the meaning of the Private Securities Litigation Reform Act of 1995. These forward-looking statements reflect our current views with respect to, among other things, the Company’s targets and outlook for future reporting periods (including the extent and timing of revenue and profit trends and the Consumer Beauty division’s stabilization), establishing the Company as a global leader and challenger in beauty, its future operations and strategy (including brand relaunches and performance in emerging markets and channels), synergies, savings, performance, cost, timing and integration relating to our recent acquisitions (including The Procter & Gamble Company’s beauty business (the “P&G Beauty Business”)), ongoing and future cost efficiency and restructuring initiatives and programs (including timing and impact), strategic transactions (including mergers and acquisitions, joint ventures, investments, divestitures, licenses and portfolio rationalizations), future cash flows and liquidity, future performance in digital and e-commerce and the expected impact of our digital transformation agenda, future effective tax rates, timing and size of cash outflows and debt deleveraging, and impact and timing of supply chain disruptions and our actions to address such disruptions. These forward-looking statements are generally identified by words or phrases, such as “anticipate”, “are going to”, “estimate”, “plan”, “project”, “expect”, “believe”, “intend”, “foresee”, “forecast”, “will”, “may”, “should”, “outlook”, “continue”, “temporary”, “target”, “aim”, “potential” and similar words or phrases. These statements are based on certain assumptions and estimates that we consider reasonable, but are subject to a number of risks and uncertainties, many of which are beyond our control, which could cause actual events or results (including our financial condition, results of operations, cash flows and prospects) to differ materially from such statements, including:
- the Company’s ability to achieve its global business strategies, compete effectively in the beauty industry and achieve the benefits contemplated by its strategic initiatives (including sell-through of its relaunched brands, enhancement of its innovation pipeline, focus on emerging markets and channels, improvement of in-store execution and reduction in discounts in certain markets) within the expected time frame or at all;
- the Company’s ability to anticipate, gauge and respond to market trends and consumer preferences, which may change rapidly, and the market acceptance of new products, including any relaunched or rebranded products, execution of new launches, and the anticipated costs and discounting associated with such relaunches and rebrands, and consumer receptiveness to our marketing and consumer engagement activities (including digital marketing and media);
- use of estimates and assumptions in preparing the Company’s financial statements, including with regard to revenue recognition, stock compensation expense, income taxes, the assessment of goodwill, other intangible assets and long-lived assets for impairment, the market value of inventory, pension expense and the fair value of acquired assets and liabilities associated with acquisitions;
- managerial, integration, operational, regulatory, legal and financial risks, including diversion of management attention to and management of, cash flows, expenses and costs associated with multiple ongoing and future strategic initiatives and internal reorganizations;
- the continued integration of the P&G Beauty Business and other recent acquisitions with the Company's business, operations, systems, financial data and culture and the ability to realize synergies, avoid future supply chain and other business disruptions, reduce costs (including through the Company's cash efficiency initiatives) and realize other potential efficiencies and benefits (including through the Company's restructuring initiatives) at the levels and at the costs and within the time frames contemplated or at all;
- increased competition, consolidation among retailers, shifts in consumers’ preferred distribution and marketing channels (including to digital and luxury channels), distribution and shelf-space resets or reductions, compression of go-to-market cycles, changes in product and marketing requirements by retailers, reductions in retailer inventory levels and order lead-times or changes in purchasing patterns, and other changes in the retail, e-commerce and wholesale environment in which the Company does business and sells its products and the Company's ability to respond to such changes;
- the Company and its business partners' and licensors' abilities to obtain, maintain and protect the intellectual property used in its and their respective businesses, protect its and their respective reputations (including those of its and their executives or influencers), public goodwill, and defend claims by third parties for infringement of intellectual property rights;
- the effect of the divestiture and discontinuation of the Company’s non-core brands (including associated subsequent cost reduction programs) and rationalizing wholesale distribution by reducing the amount of product diversion to the value and mass channels;
- any change to the Company's capital allocation and/or cash management priorities;
- any unanticipated problems, liabilities or other challenges associated with an acquired business which could result in increased risk or new, unanticipated or unknown liabilities, including with respect to environmental, competition and other regulatory, compliance or legal matters;
- the Company’s international operations and joint ventures, including enforceability and effectiveness of its joint venture agreements and reputational, compliance, regulatory, economic and foreign political risks, including difficulties and costs associated with maintaining compliance with a broad variety of complex local and international regulations;
- the Company's dependence on certain licenses (especially in its Luxury division) and the Company's ability to renew expiring licenses on favorable terms or at all;
- the Company's dependence on entities performing outsourced functions, including outsourcing of distribution functions, third-party manufacturers, logistics and supply chain suppliers, and other suppliers, including third-party software providers;
- administrative, development and other difficulties in meeting the expected timing of market expansions, product launches and marketing efforts;
- global political and/or economic uncertainties, disruptions or major regulatory or policy changes, and/or the enforcement thereof that affect our business, financial performance, operations or products, including the impact of Brexit, the current U.S. administration, the results of elections in European countries and in Brazil, changes in the U.S. tax code and recent changes and future changes in tariffs, retaliatory or trade protection measures, trade policies and other international trade regulations in the U.S. and in other regions where the Company operates including the European Union and China;
- currency exchange rate volatility and currency devaluation;
- the number, type, outcomes (by judgment, order or settlement) and costs of legal, compliance, tax, regulatory or administrative proceedings, and/or litigation;
- the Company’s ability to manage seasonal and other variability and to anticipate future business trends and needs;
- disruptions in operations and sales, including due to disruptions in supply chain, logistics, restructurings and other business alignment activities, manufacturing or information technology systems, labor disputes, extreme weather and natural disasters, and the impact of such disruptions on the Company's ability to generate profits, stabilize or grow revenues or cash flows, comply with its contractual obligations and accurately forecast demand and supply needs and/or future results;
- restrictions imposed on the Company through its license agreements, credit facilities and senior unsecured bonds or other material contracts, its ability to generate cash flow to repay, refinance or recapitalize debt, and changes in the manner in which the Company finances its debt and future capital needs;
- increasing dependency on information technology and the Company’s ability to protect against service interruptions, data corruption, cyber-based attacks or network security breaches, costs and timing of implementation and effectiveness of any upgrades or other changes to information technology systems, including the Company's digital transformation initiatives, and the cost of compliance or the Company's failure to comply with any privacy or data security laws (including the European Union General Data Protection Regulation or to protect against theft of customer, employee and corporate sensitive information;
- the Company's ability to attract and retain key personnel;
- the distribution and sale by third parties of counterfeit and/or gray market versions of the Company’s products; and
- other factors described elsewhere in this document and from time to time in documents that the Company file with the SEC.
When used herein, the term “includes” and “including” means, unless the context otherwise indicates, “including without limitation”. More information about potential risks and uncertainties that could affect the Company’s business and financial results is included under the heading “Risk Factors” and “Management’s Discussion and Analysis of Financial Condition and Results of Operations” in the Company’s Annual Report on Form 10-K for the fiscal year ended June 30, 2018 and other periodic reports the Company has filed and may file with the SEC from time to time.
All forward-looking statements made in this release are qualified by these cautionary statements. These forward-looking statements are made only as of the date of this release, and the Company does not undertake any obligation, other than as may be required by applicable law, to update or revise any forward-looking or cautionary statements to reflect changes in assumptions, the occurrence of events, unanticipated or otherwise, or changes in future operating results over time or otherwise.
Comparisons of results for current and any prior periods are not intended to express any future trends or indications of future performance unless expressed as such, and should only be viewed as historical data.
Non-GAAP Financial Measures
The Company operates on a global basis, with the majority of net revenues generated outside of the U.S. Accordingly, fluctuations in foreign currency exchange rates can affect results of operations. Therefore, to supplement financial results presented in accordance with GAAP, certain financial information is presented excluding the impact of foreign currency exchange translations to provide a framework for assessing how the underlying businesses performed excluding the impact of foreign currency exchange translations (“constant currency”). Constant currency information compares results between periods as if exchange rates had remained constant period-over-period, with the current period’s results calculated at the prior-year period’s rates. The Company calculates constant currency information by translating current and prior-period results for entities reporting in currencies other than U.S. dollars into U.S. dollars using constant foreign currency exchange rates. The constant currency calculations do not adjust for the impact of revaluing specific transactions denominated in a currency that is different to the functional currency of that entity when exchange rates fluctuate. The constant currency information presented may not be comparable to similarly titled measures reported by other companies. The Company discloses the following constant currency financial measures: net revenues, organic like-for-like (LFL) net revenues, adjusted gross profit and adjusted operating income.
The Company presents period-over-period comparisons of net revenues on a constant currency basis as well as on an organic (LFL) basis. The Company believes that organic (LFL) better enable management and investors to analyze and compare the Company's net revenues performance from period to period. For the period described in this release, the term “like-for-like” describes the Company's core operating performance, excluding the financial impact of (i) acquired brands or businesses in the current year period until we have twelve months of comparable financial results, (ii) divested brands or businesses or early terminated brands in the prior year period to maintain comparable financial results with the current fiscal year period and (iii) foreign currency exchange translations to the extent applicable. For a reconciliation of organic (LFL) period-over-period, see the table entitled “Reconciliation of Reported Net Revenues to Like-For-Like Net Revenues”.
The Company presents operating income, operating income margin, gross profit, gross margin, effective tax rate, net income, net income margin, net revenues and EPS (diluted) on a non-GAAP basis and specifies that these measures are non-GAAP by using the term “adjusted”. The Company believes these non-GAAP financial measures better enable management and investors to analyze and compare operating performance from period to period. In calculating adjusted operating income, operating income margin, gross profit, gross margin, effective tax rate, net income, net income margin and EPS (diluted), the Company excludes the following items:
- Costs related to acquisition activities: The Company excludes acquisition-related costs and acquisition accounting impacts such as those related to transaction costs and costs associated with the revaluation of acquired inventory in connection with business combinations because these costs are unique to each transaction. The nature and amount of such costs vary significantly based on the size and timing of the acquisitions and the maturities of the businesses being acquired. Also, the size, complexity and/or volume of past acquisitions, which often drives the magnitude of such expenses, may not be indicative of the size, complexity and/or volume of any future acquisitions.
- Restructuring and other business realignment costs: The Company excludes costs associated with restructuring and business structure realignment programs to allow for comparable financial results to historical operations and forward-looking guidance. In addition, the nature and amount of such charges vary significantly based on the size and timing of the programs. By excluding the above referenced expenses from the non-GAAP financial measures, management is able to evaluate the Company’s ability to utilize existing assets and estimate their long-term value. Furthermore, management believes that the adjustment of these items supplement the GAAP information with a measure that can be used to assess the sustainability of the Company’s operating performance.
- Asset impairment charges: We have excluded the impact of asset impairments as such non-cash amounts are inconsistent in amount and frequency and are significantly impacted by the timing and/or size of acquisitions. Our management believes that the adjustment of these items supplement the GAAP information with a measure that can be used to assess the sustainability of our operating performance.
- Amortization expense: The Company excludes the impact of amortization of finite-lived intangible assets, as such non-cash amounts are inconsistent in amount and frequency and are significantly impacted by the timing and/or size of acquisitions. Management believes that the adjustment of these items supplement the GAAP information with a measure that can be used to assess the sustainability of the Company’s operating performance. Although the Company excludes amortization of intangible assets from the non-GAAP expenses, management believes that it is important for investors to understand that such intangible assets contribute to revenue generation. Amortization of intangible assets that relate to past acquisitions will recur in future periods until such intangible assets have been fully amortized. Any future acquisitions may result in the amortization of additional intangible assets.
- Interest and other (income) expense: The Company excludes foreign currency impacts associated with acquisition-related and debt financing related forward contracts, as well as debt financing transaction costs as the nature and amount of such charges are not consistent and are significantly impacted by the timing and size of such transactions.
- Loss on early extinguishment of debt: We have excluded loss on extinguishment of debt as this represents a non-cash charge, and the amount and frequency of such charges is not consistent and is significantly impacted by the timing and size of debt financing transactions.
- Noncontrolling interest: This adjustment represents the after-tax impact of the non-GAAP adjustments included in Net income attributable to noncontrolling interests based on the relevant non-controlling interest percentage.
- Tax: This adjustment represents the impact of the tax effect of the pretax items excluded from Adjusted net income. The tax impact of the non-GAAP adjustments are based on the tax rates related to the jurisdiction in which the adjusted items are received or incurred.
The estimated supply chain impact to adjusted operating income only includes the direct impact on net revenues and the associated impact on cost of sales, while the Company assumed no impact from any other operating expenses.
The Company has provided a quantitative reconciliation of the difference between the non-GAAP financial measures and the financial measures calculated and reported in accordance with GAAP. For a reconciliation of adjusted gross profit to gross profit, adjusted EPS (diluted) to EPS (diluted), and adjusted net revenues to net revenues, see the table entitled “Reconciliation of Reported to Adjusted Results for the Consolidated Statements of Operations.” For a reconciliation of adjusted operating income to operating income and adjusted operating income margin to operating income margin, see the tables entitled “Reconciliation of Reported Operating Income (Loss) to Adjusted Operating Income” and "Reconciliation of Reported Operating Income (Loss) to Adjusted Operating Income by Segment." For a reconciliation of adjusted effective tax rate and adjusted cash tax rate to effective tax rate, see the table entitled “Reconciliation of Reported (Loss) Income Before Income Taxes and Effective Tax Rates to Adjusted Income Before Income Taxes, Effective Tax Rates and Cash Tax Rates.” For a reconciliation of adjusted net income and adjusted net income margin to net income (loss), see the table entitled “Reconciliation of Reported Net Income to Adjusted Net Income.”
The Company also presents free cash flow, adjusted EBITDA and net debt. Management believes that these measures are useful for investors because it provides them with an important perspective on the cash available for debt repayment and other strategic measures and provides them with the same measures that management uses as the basis for making resource allocation decisions. Free cash flow is defined as net cash provided by operating activities, less capital expenditures, adjusted EBITDA is defined as adjusted operating income less depreciation and net debt is defined as total debt less cash and cash equivalents. For a reconciliation of Free Cash Flow, see the table entitled “Reconciliation of Net Cash Provided by Operating Activities to Free Cash Flow,” for adjusted EBITDA, see the table entitled “Reconciliation of Adjusted Operating Income to Adjusted EBITDA” and for net debt, see the table entitled “Reconciliation of Total Debt to Net Debt.”
These non-GAAP measures should not be considered in isolation, or as a substitute for, or superior to, financial measures calculated in accordance with GAAP.
To the extent that the Company provides guidance, it does so only on a non-GAAP basis and does not provide reconciliations of such forward-looking non-GAAP measures to GAAP due to the inherent difficulty in forecasting and quantifying certain amounts that are necessary for such reconciliation, including adjustments that could be made for restructuring, integration and acquisition-related expenses, amortization expenses, adjustments to inventory, and other charges reflected in our reconciliation of historic numbers, the amount of which, based on historical experience, could be significant.
Additional Tables
Click here for Additional Tables.
For more information contact :
Investor Relations
Christina Frank, +1 212 389-6802
Olga Levinzon, +1 212 389-7733
Media Relations
Jennifer Friedman, +1 917 754-8399