Coty Inc. reports fiscal 2017 fourth quarter and full year results

SHARE WITH :
Financial IMAGES
- Reports improved fourth quarter underlying net revenue trend
- Integration progressing well
Coty Inc. (NYSE: COTY) today announced financial results for the fourth quarter and fiscal year ended June 30, 2017.
* As compared to combined Coty and P&G Beauty Business net revenues (herein defined as "Combined Company"). These measures, as well as “free cash flow,” are Non-GAAP Financial Measures. Refer to “Basis of Presentation and Exceptional Items” and “Non-GAAP Financial Measures” for discussion of these measures. Net Income (Loss) represents Net Income (Loss) Attributable to Coty Inc. Reconciliations from reported to adjusted results can be found at the end of this release. Combined Company year-over-year change in net revenues is presented giving effect to the completion of the acquisition of the P&G Beauty Business, as if the acquisition had occurred as of July 1, 2015. “NM” indicates calculation not meaningful.
Fourth Quarter Fiscal 2017 Summary
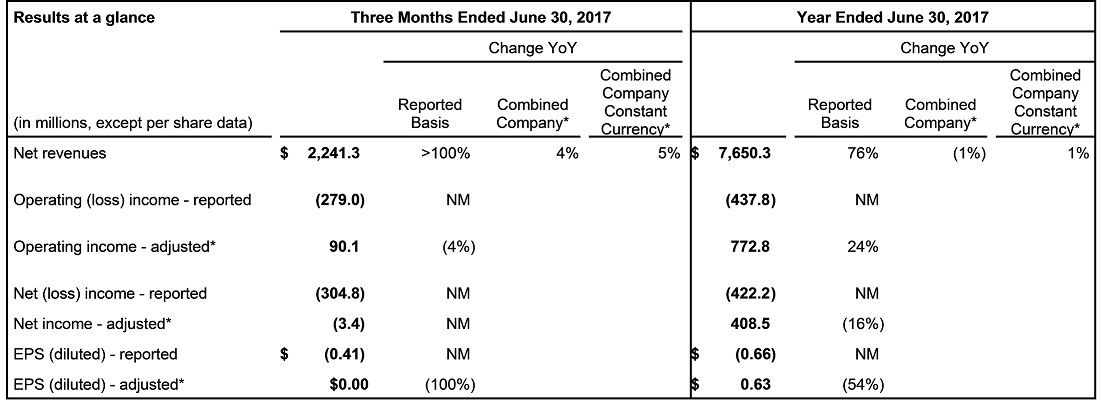
- Net revenues of $2,241.3 million increased >100% as reported compared to Legacy-Coty net revenues in the prior-year period, and increased 5% for the combined company at constant currency compared to the prior year
- Excluding the positive contribution from the acquisitions of ghd and Younique, combined company organic net revenues declined 3% on a constant currency basis, which includes a 1% net benefit as a result of pre-shipments to customers in advance of the termination of the Transition Services Agreement ("TSA") for Europe which occurred on July 1
- Reported operating loss of $(279.0) million increased from $(2.9) million for Legacy-Coty in the prior-year period driven primarily by a net increase of $190.2 million in restructuring and acquisition related costs, and a $35.6 million net increase in amortization expense primarily due to acquisitions
- Adjusted operating income of $90.1 million decreased from $94.2 million for Legacy-Coty in the prior-year period
- Reported net loss of $(304.8) million increased from $(31.0) million for Legacy-Coty in the prior-year period, while adjusted net loss of $(3.4) million declined from income of $45.7 million for Legacy-Coty
- Reported earnings per diluted share of $(0.41) declined from $(0.09) for Legacy-Coty in the prior-year period, while adjusted earnings per diluted share of $0.00 decreased from $0.13 for Legacy-Coty
- Net cash provided by operating activities was $50.8 million compared to $56.1 million for Legacy-Coty in the prior-year period
Fiscal 2017 Summary
- Net revenues of $7,650.3 million increased 76% as reported compared to Legacy-Coty net revenues in the prior year, and grew 1% on a combined company constant currency basis
- Excluding the positive contribution from the acquisitions of ghd, Younique, and seven additional months of Hypermarcas Brands, the combined company organic net revenues declined 5% on a constant currency basis
- Reported operating loss of $(437.8) million declined from income of $254.2 million for Legacy-Coty in the prior year, driven primarily by a net increase of $466.7 million in restructuring and acquisition costs and a $195.6 million net increase in amortization expense primarily due to acquisitions
- Adjusted operating income of $772.8 million increased 24% from $622.9 million for Legacy-Coty
- Reported net loss of $(422.2) million decreased from income of $156.9 million for Legacy-Coty in the prior year while adjusted net income of $408.5 million decreased from $485.2 million • Reported earnings per diluted share of $(0.66) decreased from $0.44 for Legacy-Coty in the prior year, while adjusted earnings per diluted share of $0.63 decreased from $1.37 for Legacy-Coty in part due to a larger tax benefit in fiscal 2016
- Net cash provided by operating activities was $757.5 million compared to $501.4 million for Legacy-Coty in the prior year reflecting improved working capital for the combined company, partially offset by an increase in cash acquisition and restructuring costs.
Commenting on Coty’s performance, Camillo Pane, CEO said: “Fiscal 2017 was a transformational year for Coty. We completed the incredibly complex acquisition of the P&G Beauty Business, fully reorganized into a product and customer focused organizational structure, successfully reached significant milestones in our integration efforts, and boosted our brand portfolio through the additions of Younique, ghd, and the agreement to acquire the Burberry Beauty license. Equally important, we believe the strategy we outlined earlier in the year which focuses on strengthening our global brands, shifting more resources to fuel the growth of the brands with higher growth potential, stabilizing the remaining brands, and continuing to expand the geographic reach of our portfolio, is beginning to bear fruit as demonstrated by the improvement in net revenue trends in the second half of the fiscal year.
Our Q4 results continued to demonstrate that our Professional and Luxury divisions are performing well. Professional Beauty's positive performance was driven by continued growth in Wella and improving trends at OPI, and the Luxury division delivered strong growth for the second quarter in a row supported by Hugo Boss, Gucci, Chloe and philosophy. On the other hand, our Consumer Beauty division remains under pressure and its recovery is a key priority for us.
Fourth quarter adjusted operating income declined year-over-year as a result of materially higher marketing spend to drive further revenue momentum in our business and to achieve flawless execution at retail for key launches. Profit was also impacted by a higher combined company fixed cost base that we are rapidly working to address as part of our synergy program and organic efficiency initiatives. Our cost base is not where it should be and we are highly focused on this issue as a key initiative for Fiscal 2018. On a separate note, our cash generation has been strong through the year, underlining its continued strength.
Regarding the P&G Beauty Business, our integration efforts are proceeding well and we remain on track with the synergy delivery. In Q4, we’ve achieved another significant milestone as Europe successfully exited its TSA on July 1, following North America’s TSA exit on May 1. ALMEA continues to progress well towards the final TSA exit expected in September.
On the M&A front, the combined impact of the acquisitions of the Hypermarcas Brands, ghd and Younique now represents a material addition to Coty's results and I am pleased with the contribution of these businesses.
In conclusion, I am proud of what we have been able to accomplish in less than a year since the transformational acquisition of the P&G Beauty Business and remain confident in our potential to establish Coty as a global leader and challenger in beauty."
Basis of presentation
To supplement financial results presented in accordance with GAAP, certain financial information is presented in this release using the non-GAAP financial measures described in this section. The term “combined company” describes net revenues of Coty Inc. and the P&G Beauty Business giving effect to the Merger for purposes of the three and twelve months ended June 30, 2017 as if it had occurred on July 1, 2015. Combined company year-over-year and combined company constant currency year-over-year do not include any adjustments related to potential profit improvements, potential cost savings or adjustments to fully conform to the accounting policies of Coty. The term “combined company constant currency” describes the combined company net revenues excluding the effect of foreign currency exchange translations. The term “adjusted” primarily excludes the impact of restructuring and business realignment costs, amortization, costs related to acquisition activities, private company share-based compensation expense, and asset impairment charges to the extent applicable. Refer to “Non-GAAP Financial Measures” below for additional discussion of these measures as well as the definition of free cash flow.
Net revenues are reported by segment and geographic region and are presented on a reported (GAAP), combined company and combined company constant currency basis. Operating income is reported by segment. All changes in margin percentage are described in basis points rounded to the nearest tenth of a percent. Operating income, net income, operating income margin, gross margin, effective tax rate, and earnings per diluted share (EPS (diluted)) are presented on a reported (GAAP) basis and an adjusted (non-GAAP) basis. Adjusted EPS (diluted) is a performance measure and should not be construed as a measure of liquidity. Net revenues on a combined company basis, net revenues on a combined company constant currency basis, adjusted operating income, adjusted operating income on a constant currency basis, adjusted operating income margin, adjusted effective tax rate, adjusted net income, adjusted gross margin, adjusted EPS (diluted) and free cash flow are non-GAAP financial measures. Refer to "Non-GAAP Financial Measures" below for additional discussion of these measures. A reconciliation between GAAP and non-GAAP results can be found in the tables and footnotes at the end of this release.
To the extent that Coty provides guidance, it only does so only on a non-GAAP basis and does not provide reconciliations of such forward-looking non-GAAP measures to GAAP due to the inherent difficulty in forecasting and quantifying certain amounts that are necessary for such reconciliation, including adjustments that could be made for restructuring, integration and acquisition-related expenses, amortization expenses, adjustments to inventory, and other charges reflected in our reconciliation of historic numbers, the amount of which, based on historical experience, could be significant.
Fiscal 2017 Summary Operating Review
Net revenues of $7,650.3 million increased 76% as reported compared to Legacy-Coty net revenues in the prior year and grew 1% combined company constant currency compared to the prior year. The performance reflected a strong contribution from the acquisitions of ghd, Younique, and seven months of the Hypermarcas Brands, and a 5% decline in organic combined company net revenues. The 5% organic decline was driven by flat performance in Professional Beauty, a modest decline in Luxury, and continued underlying challenges in Consumer Beauty.
Reported gross margin of 60.4% increased from 59.9% for Legacy-Coty in the prior-year, while adjusted gross margin of 62.4% increased from 60.4% for Legacy-Coty in the prior-year, reflecting the addition of the higher gross margin P&G Beauty Business and Younique.
Reported operating loss declined to $(437.8) million from income of $254.2 million for Legacy-Coty in the prior year, as the income contribution from the acquired businesses was more than offset by increased restructuring, amortization, and acquisition related costs. As a percentage of net revenues, operating margin declined to (5.7)% from 5.8% in the prior-year.
Adjusted operating income increased 24% to $772.8 million from $622.9 million for Legacy-Coty in the prior year, reflecting the profit contribution from P&G Beauty Business and Younique. As a percentage of net revenues, the adjusted operating margin decreased 420 basis points to 10.1% from 14.3% for Legacy-Coty due to materially higher marketing spend as a percentage of net revenues and the additional fixed costs arising from the formation of the new combined company, including operating under the TSA with P&G. The reduction in the adjusted operating margin was also due to revenue declines in the combined company.
Reported effective tax rate was 39.4% compared to (29.1%) for Legacy-Coty in the prior year.
Adjusted effective tax rate was 17.3% compared to 1.9% for Legacy-Coty in the prior year, reflecting a lower tax benefit realized in fiscal 2017 of $39 million compared to the tax benefit realized in fiscal 2016 of $113 million.
Reported net income decreased to $(422.2) million from $156.9 million for Legacy-Coty in the prior year, reflecting both lower operating income and a smaller tax benefit than in the prior year.
Adjusted net income decreased to $408.5 million from $485.2 million for Legacy-Coty in the prior year, reflecting higher adjusted operating income more than offset by higher interest and tax expense. As a percentage of net revenues, adjusted net income margin decreased 590 basis points to 5.3% from 11.2% in the prior-year.
Cash flows
- Net cash provided by operating activities for fiscal 2017 was $757.5 million, compared to $501.4 million for Legacy-Coty in the prior year reflecting improved working capital for the combined company, partly offset by an increase in cash acquisition related and restructuring costs.
- Free cash flow in fiscal 2017 of $325.2 million decreased from $351.3 million in the prior year, reflecting a significant increase in capital expenditures associated with the P&G Beauty Business integration.
- On June 13, 2017, the Company paid a quarterly dividend of $0.125 per share for a total of $93.4 million.
- Cash and cash equivalents of $535.4 million increased by $163.0 million, total debt of $7,215.6 million increased by $3,045.5 million, with net debt of $6,680.2 million up $2,882.5 million from the balance on June 30, 2016. This increase reflected the assumption of approximately $1,941.8 million of debt as part of the P&G Beauty Business transaction and financings for the acquisition of ghd and the investment in Younique.
Fiscal 2017 Business Review by Segment
Luxury
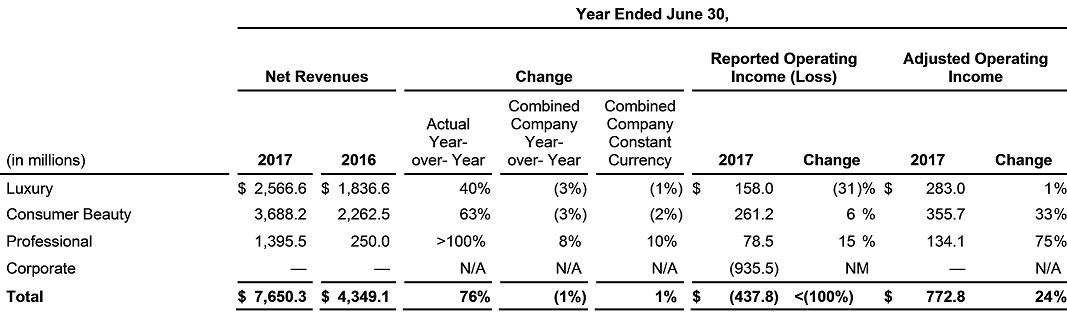
- Luxury net revenues of $2,566.6 million increased 40% as reported compared to Legacy-Coty net revenues in the prior-year reflecting the contribution from the acquired P&G Beauty Business. Luxury net revenues decreased 1% for the combined company at constant currency compared to the prior year, reflecting declines in Calvin Klein and Marc Jacobs partly offset by growth in Hugo Boss, philosophy and Chloe.
- Adjusted operating income of $283.0 million increased 1% from $279.4 million in the prior-year, resulting in a 11.0% adjusted operating income margin, a decrease of 420 basis points versus Legacy-Coty in the prior-year.
Consumer Beauty
- Consumer Beauty net revenues of $3,688.2 million increased 63% as reported compared to Legacy-Coty net revenues in the prior year reflecting the contribution from the acquired P&G Beauty Business, Younique and Hypermarcas Brands. Consumer Beauty net revenues decreased 2% for the combined company at constant currency compared to the prior year, reflecting a 10% organic decline largely offset by positive contributions from both Younique and seven months of the Hypermarcas Brands. The organic decline reflected weakness in several of the acquired P&G Beauty Business brands COVERGIRL, Clairol and Wella Retail, as well as continued weakness in the U.S. nail category which pressured the Sally Hansen brand.
- Adjusted operating income of $355.7 million increased 33% from $267.0 million in the prior-year, resulting in a 9.6% adjusted operating income margin, a decrease of 220 basis points versus Legacy-Coty in the prior year.
Professional Beauty
- Professional Beauty net revenues of $1,395.5 million increased from $250.0 million for Legacy-Coty net revenues in the prior year reflecting the contribution from the P&G Beauty Business and ghd acquisitions. Professional Beauty net revenues increased 10% for the combined company at constant currency compared to the prior year, reflecting flat organic net revenues and a positive contribution from ghd. Strong momentum in Wella and System Professional salon hair care was offset by declines in OPI, though these declines moderated in Q4 compared to prior quarters.
- Adjusted operating income of $134.1 million increased 75% from $76.5 million in the prior-year, resulting in a 9.6% adjusted operating income margin, a decrease from 30.6% for Legacy-Coty in the prior year.
Fiscal 2017 Business Review by Geographic Region
North America
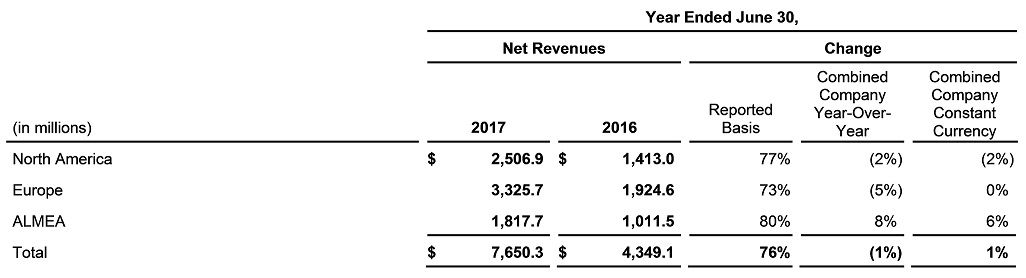
- Reported net revenues increased 77% compared to Legacy-Coty in the prior year and declined 2% for the combined company at constant currency compared to the prior year, driven by declines in the U.S., primarily in the Consumer Beauty division.
Europe
- Reported net revenues increased 73% compared to Legacy-Coty in the prior year and was flat for the combined company at constant currency compared to the prior year.
ALMEA
- Reported net revenues increased 80% compared to Legacy-Coty in the prior year and grew 6% for the combined company at constant currency compared to the prior year, driven by positive organic growth in Brazil, the Middle East and Australia, as well as the contribution from seven months of Hypermarcas Brands.
Fourth Quarter Fiscal 2017 Summary Operating Review
- For the three months ended June 30, 2017, the Company reported net revenues of $2,241.3 million, up from $1,075.6 million for Legacy-Coty in the prior-year period, an increase of 5% for the combined company at constant currency in the prior-year period. The 5% combined company constant currency net revenue growth reflected a positive contribution from the acquisitions of ghd and Younique, and a 3% organic decline which included a 1% net benefit from pre-shipments to customers in advance of the Europe TSA exit.
- Luxury net revenues grew 61% as reported and 5% organically, supported by strong performance at Hugo Boss, Gucci, Chloe and philosophy brands. Consumer Beauty increased 85% as reported and declined 10% organically, reflecting continued pressure on COVERGIRL, Clairol, and Sally Hansen. Professional Beauty net revenues of $467.3 million increased from $63.6 million in the prior year and increased 3% organically, driven by growth in Wella and System Professional and moderating declines in OPI.
- Reported operating loss of $(279.0) million declined from $(2.9) million in the prior-year period, driven primarily by a net increase of $190.2 million in restructuring and acquisition related costs and a $35.6 million net increase in amortization expense.
- Adjusted operating income declined 4% to $90.1 million, primarily driven by a higher level of marketing investment to support the momentum in the business as well as a higher fixed cost base. Adjusted operating margin as a percentage of adjusted net revenues decreased to 4.0% compared to 8.8% in the prior-year period.
- Reported net loss attributable to Coty Inc. declined to $(304.8) million from a net loss of $(31.0) million, primarily driven by lower reported operating income.
- Adjusted net income attributable to Coty Inc. declined to $(3.4) million from $45.7 million in the prior-year period, primarily driven by lower adjusted operating income and higher interest expense. Reported earnings per diluted share declined to $(0.41) from $(0.09) in the prior-year period. Adjusted net earnings per diluted share of $0.00 decreased from $0.13 in the prior-year period.
- Net cash provided by operating activities was $50.8 million compared to $56.1 million in the prior-year period.
Noteworthy Company Developments
Other noteworthy company developments include:
- On May 1, 2017 and July 1, 2017, the Company exited from the Transition Services Agreements in North America and Europe, respectively. As a result, Coty is now in full control of processes, systems and data for all aspects of the Company's expanded businesses in these regions and impacted export countries.
- On August 22, 2017 Coty announced a dividend of $0.125, payable on September 14, 2017 to stockholders of record at the close of business on September 1, 2017.
Conference Call
Coty Inc. will host a conference call at 8:00 a.m. (ET) today, August 22, 2017 to discuss its results. The dial-in number for the call is (855) 889-8783 in the U.S. or (720) 634-2929 internationally (conference passcode number: 62175874). The call will also be webcast live at https://investors.coty.com. The conference call will be available for replay. The replay dial-in number is (855) 859-2056 in the U.S. or (404) 537-3406 outside the U.S. (conference passcode number: 62175874).
About Coty Inc.
Coty is one of the world’s largest beauty companies with approximately $9 billion in revenue, with a purpose to celebrate and liberate the diversity of consumers’ beauty. Its strong entrepreneurial heritage has created an iconic portfolio of leading beauty brands. Coty is the global leader in fragrance, a strong number two in professional salon hair color & styling, and number three in color cosmetics. Coty operates three divisions - Consumer Beauty, which is focused on mass color cosmetics, mass retail hair coloring and styling products, body care and mass fragrances with brands such as COVERGIRL, Max Factor and Rimmel; Luxury, which is focused on prestige fragrances and skincare with brands such as Calvin Klein, Marc Jacobs, Hugo Boss, Gucci and philosophy; and Professional Beauty, which is focused on servicing salon owners and professionals in both hair and nail, with brands such as Wella Professionals, Sebastian Professional, OPI and ghd. Coty has over 20,000 colleagues globally and its products are sold in over 150 countries. Coty and its brands are committed to a range of social causes as well as seeking to minimize its impact on the environment. For additional information about Coty Inc., please visit www.coty.com.
Forward Looking Statements
Certain statements in this release are “forward-looking statements” within the meaning of the Private Securities Litigation Reform Act of 1995. These forward-looking statements reflect the Company’s current views with respect to, among other things, returning to top line growth (and other revenue trends), establishing Coty as a global leader and challenger in beauty, TSA exits, its future operations and financial performance, ongoing cost efficiency initiatives, the timing and presentation of future cost saving plans, its ability to support its planned business operations on a near- and long-term basis, mergers and acquisitions, divestitures, transitions, path to recovery, synergies or growth from acquisitions, results of ongoing efficiency initiatives, future dividends, the success of the integration of the P&G Beauty Business, and any outlook for future reporting periods. These forward-looking statements are generally identified by words or phrases, such as “anticipate”, “are going to”, “estimate”, “plan”, “project”, “expect”, “believe”, “intend”, “foresee”, “forecast”, “will”, “may”, “should”, “outlook”, “continue”, “target”, “aim”, "potential" and similar words or phrases. These statements are based on certain assumptions and estimates that the Company considers reasonable and are subject to a number of risks and uncertainties, many of which are beyond the Company’s control, which could cause actual events or results to differ materially from such statements, including:
- the Company’s ability to achieve its global business strategies, compete effectively in the beauty industry and achieve the benefits contemplated by its recent strategic transactions within the expected time frame or at all;
- use of estimates and assumptions in preparing the Company’s financial statements, including with regard to revenue recognition, stock compensation expense, the assessment of goodwill, other intangible assets and long-lived assets for impairment, the market value of inventory, pension expense and the fair value of acquired assets and liabilities associated with acquisitions;
- managerial, integration, operational, regulatory, legal and financial, including management of cash flows, and expenses associated with the Company’s strategic transactions and internal reorganizations;
- the integration of the P&G Beauty Business with Legacy-Coty business, operations, systems, financial data and culture (including the recent exits and anticipated future exit of the Transition Services Agreement and implementation of the Company’s Global Integration Activities) and the ability to realize synergies, reduce costs and other potential efficiencies and benefits at the levels and at the costs and within the time frames currently contemplated or at all;
- the Company’s ability to anticipate, gauge and respond to market trends and consumer preferences, which may change rapidly, and the market acceptance of new products, including any relaunched or rebranded products;
- increased competition, consolidation among retailers, shifts in consumers’ preferred distribution channels (including to digital channels) and other changes in the retail, e-commerce and wholesale environment in which the Company does business and sells its products;
- changes in law, regulations and policies that affect the Company’s business, operations or its products;
- the Company and its brand partners' and licensors' ability to obtain, maintain and protect the intellectual property rights, including trademarks, brand names and other intellectual property used in their respective businesses, products and software, and their abilities to protect their respective reputations and defend claims by third parties for infringement of intellectual property rights;
- the Company’s ability to successfully execute its announced intent to divest and/or discontinue non-core brands and to rationalize wholesale distribution by reducing the amount of product diversion to the value and mass channels;
- any unanticipated problems, liabilities or other challenges associated with an acquired business which could result in increased risk of new, unanticipated or unknown liabilities, including with respect to environmental, competition and other regulatory matters;
- the Company’s international operations and joint ventures, including reputational, compliance, regulatory, economic and foreign political risks, including difficulties and costs associated with maintaining compliance with a broad variety of complex domestic and international regulations;
- the Company’s dependence on certain licenses, entities performing outsourced functions and third-party suppliers, including third party software providers;
- administrative, development and other difficulties in meeting the expected timing of market expansions, product launches and marketing efforts;
- global political and/or economic uncertainties or disruptions, including the impact of Brexit and the new U.S. administration;
- the number, type, outcomes (by judgment, order or settlement) and costs of legal, tax, regulatory or administrative proceedings, and/or litigation;
- the Company’s ability to manage seasonal and other variability and to anticipate future business trends based on the information available to it under the TSA with respect to the P&G Beauty Business;
- disruptions in operations, including due to disruptions or consolidation in supply chain, restructurings, manufacturing rights or information systems, labor disputes and natural disasters;
- restrictions imposed on the Company through its license agreements and credit facilities and changes in the manner in which the Company finances its debt and future capital needs, including potential acquisitions;
- increasing dependency on information technology and the Company’s ability to protect against service interruptions, data corruption, cyber-based attacks or network security breaches, costs and timing of implementation and effectiveness of any upgrades to information technology systems, inability to control the quality or level of detail of financial data provided by third parties, and its failure to comply with any privacy or data security laws or to protect against theft of customer, employee and corporate sensitive information;
- the Company’s ability to attract and retain key personnel, including during times of transition and restructurings;
- the distribution and sale by third parties of counterfeit and/or gray market versions of the Company’s products; and
- other factors described elsewhere in this document and from time to time in documents that the Company files with the SEC.
When used herein, the term “includes” and “including” means, unless the context otherwise indicates, including without limitation. More information about potential risks and uncertainties that could affect the Company’s business and financial results is included under the heading “Risk Factors” and “Management’s Discussion and Analysis of Financial Condition and Results of Operations” in the Company’s Quarterly Report on Form 10-Q for the quarterly period ended March 31, 2017 and other periodic reports the Company has filed and may file with the SEC from time to time.
All forward-looking statements made in this release are qualified by these cautionary statements. These forward-looking statements are made only as of the date of this release, and the Company does not undertake any obligation, other than as may be required by law, to update or revise any forward-looking or cautionary statements to reflect changes in assumptions, the occurrence of events, unanticipated or otherwise, or changes in future operating results over time or otherwise.
Comparisons of results for current and any prior periods are not intended to express any future trends or indications of future performance unless expressed as such, and should only be viewed as historical data.
Non-GAAP Financial Measures
The Company operates on a global basis, with the majority of net revenues generated outside of the U.S.
Accordingly, fluctuations in foreign currency exchange rates can affect results of operations. Therefore, to supplement financial results presented in accordance with GAAP, certain financial information is presented excluding the impact of foreign currency exchange translations to provide a framework for assessing how the underlying businesses performed excluding the impact of foreign currency exchange translations (“constant currency”). Constant currency information compares results between periods as if exchange rates had remained constant period-over-period, with the current period’s results calculated at the prior-year period’s rates. The Company calculates constant currency information by translating current and prior-period results for entities reporting in currencies other than U.S. dollars into U.S. dollars using constant foreign currency exchange rates. The constant currency calculations do not adjust for the impact of revaluing specific transactions denominated in a currency that is different to the functional currency of that entity when exchange rates fluctuate. The constant currency information presented may not be comparable to similarly titled measures reported by other companies. The Company discloses the following constant currency financial measures: combined company net revenues and adjusted operating income.
The Company presents year-over-year comparisons of net revenues on a combined company and combined company constant currency basis. The Company believes that combined company year-over-year and combined company constant currency year-over-year better enable management and investors to analyze and compare the Company's net revenues performance from period to period, as the total business and individual divisions are being managed on a combined company basis. In the periods described in this release, combined company year-over-year and combined company constant currency year-over-year give effect to the completion of the Merger for purposes of the three months and twelve months ended June 30, 2017 as if it has been completed on July 1, 2015. Combined company growth and combined company constant currency growth do not include any adjustments related to potential profit improvements, potential cost savings or adjustments to fully conform to the accounting policies of Coty. For reconciliation of combined company year-over-year, combined company constant currency year-over-year, and combined company constant currency excluding the impact of acquisitions other than the acquisition of the P&G Beauty Business (“combined company organic (LFL)”) year-over-year, see the table entitled “Reconciliation of Reported Net Revenues to Combined Company Net Revenues.” For a reconciliation of the Company's combined company year-over-year, combined company constant currency year-over-year and combined company organic (LFL) by segment and geographic region, see the tables entitled “Net Revenues and Adjusted Operating Income by Segment” and “Net Revenues by Geographic Regions."
The Company presents operating income, operating income margin, gross margin, effective tax rate, net income, net income margin, net revenues and EPS (diluted) on a non-GAAP basis and specifies that these measures are non-GAAP by using the term “adjusted”. The Company believes these non-GAAP financial measures better enable management and investors to analyze and compare operating performance from period to period. In calculating adjusted operating income, operating income margin, gross margin, effective tax rate, net income, net income margin and EPS (diluted), the Company excludes following items:
- Costs related to acquisition activities: The Company excludes acquisition-related costs and acquisition accounting impacts such as those related to transaction costs and costs associated with the revaluation of acquired inventory in connection with business combinations because these costs are unique to each transaction. The nature and amount of such costs vary significantly based on the size and timing of the acquisitions and the maturities of the businesses being acquired. Also, the size, complexity and/or volume of past acquisitions, which often drives the magnitude of such expenses, may not be indicative of the size, complexity and/or volume of any future acquisitions.
- Restructuring and other business realignment costs: The Company excludes costs associated with restructuring and business structure realignment programs to allow for comparable financial results to historical operations and forward-looking guidance. In addition, the nature and amount of such charges vary significantly based on the size and timing of the programs. By excluding the above referenced expenses from the non-GAAP financial measures, management is able to evaluate the Company’s ability to utilize existing assets and estimate their long-term value. Furthermore, management believes that the adjustment of these items supplement the GAAP information with a measure that can be used to assess the sustainability of the Company’s operating performance.
- Amortization expense: The Company excludes the impact of amortization of finite-lived intangible assets, as such non-cash amounts are inconsistent in amount and frequency and are significantly impacted by the timing and/or size of acquisitions. Management believes that the adjustment of these items supplement the GAAP information with a measure that can be used to assess the sustainability of the Company’s operating performance. Although the Company excludes amortization of intangible assets from the non-GAAP expenses, management believes that it is important for investors to understand that such intangible assets contribute to revenue generation. Amortization of intangible assets that relate to past acquisitions will recur in future periods until such intangible assets have been fully amortized. Any future acquisitions may result in the amortization of additional intangible assets.
- Asset impairment charges: The Company excludes the impact of asset impairments as such non-cash amounts are inconsistent in amount and frequency and are significantly impacted by the timing and/or size of acquisitions. Management believes that the adjustment of these items supplement the GAAP information with a measure that can be used to assess the sustainability of the Company’s operating performance.
- Share-based compensation adjustment: The Company excludes the impact of the fiscal 2013 accounting modification from liability plan to equity plan accounting for the share-based compensation plans as well as other share-based compensation transactions that are not reflective of the ongoing and planned pattern of recognition for such expense. Refer to “Management’s Discussion and Analysis of Financial Condition and Results of Operations - Critical Accounting Policies and Estimates” contained in the respective forms filed with the SEC for a full discussion of the share-based compensation adjustment.
- Interest and other (income) expense: The Company excludes foreign currency impacts associated with acquisition-related and debt financing related forward contracts as the nature and amount of such charges are not consistent and are significantly impacted by the timing and size of such transactions.
- Loss on early extinguishment of debt: The Company excludes the loss on extinguishment of debt as this represents a non-cash charge, and the amount and frequency of such charges is not consistent and is significantly impacted by the timing and size of debt financing transactions.
- Tax: This adjustment represents the impact of the tax effect of the pretax items excluded from Adjusted net income. The tax impact of the non-GAAP adjustments are based on the tax rates related to the jurisdiction in which the adjusted items are received or incurred.
The Company has provided a quantitative reconciliation of the difference between the non-GAAP financial measures and the financial measures calculated and reported in accordance with GAAP. For a reconciliation of adjusted gross margin to gross margin, adjusted EPS (diluted) to EPS (diluted), and adjusted net revenues to net revenues, see the table entitled “Reconciliation of Reported to Adjusted Results for the Consolidated Statements of Operations.” For a reconciliation of adjusted operating income to operating income and adjusted operating income margin to operating income margin, see the tables entitled “Reconciliation of Reported Operating Income to Adjusted Operating Income” and "Reconciliation of Reported Operating Income to Adjusted Operating Income by Segment." For a reconciliation of adjusted effective tax rate and adjusted cash tax rate to effective tax rate, see the table entitled “Reconciliation of Reported Income Before Income Taxes and Effective Tax Rates to Adjusted Income Before Income Taxes, Effective Tax Rates and Cash Tax Rates.” For a reconciliation of adjusted net income and adjusted net income margin to net income, see the table entitled “Reconciliation of Reported Net Income to Adjusted Net Income.”
The Company also presents free cash flow. Free cash flow is defined as net cash provided by operating activities, less capital expenditures. Free cash flow excludes cash used for private company stock option exercises and cash used for acquisitions. Management believes that free cash flow is useful for investors because it provides them with an important perspective on the cash available for debt repayment and other strategic measures, after making necessary capital investments in property and equipment to support the Company's ongoing business operations, and provides them with the same measures that management uses as the basis for making resource allocation decisions. For a reconciliation of Free Cash Flow, see the table entitled “Reconciliation of Net Cash Provided by Operating Activities to Free Cash Flow.”
These non-GAAP measures should not be considered in isolation, or as a substitute for, or superior to, financial measures calculated in accordance with GAAP.
Additional Tables
Click here for Additional Tables.
For more information contact :
Investor Relations
Kevin Monaco, +1 212 389-6815
Media
Jennifer Friedman, +1 917 754-8399