Coty Inc. reports fiscal third quarter 2019 results

SHARE WITH :
Financial IMAGES
- Coty Inc. Reports Fiscal Third Quarter 2019 Results
- Third Quarter Results Show Solid Profit and Cash Delivery
- Full Year FY19 Outlook Remains On Track with Expectations
- Quarterly Dividend of $0.125 with Stock Dividend Election Program Introduced
NEW YORK - May 8, 2019 -- Coty Inc. (NYSE: COTY) today announced financial results for the third quarter of fiscal year 2019, ended March 31, 2019.
Overview
Revenues:
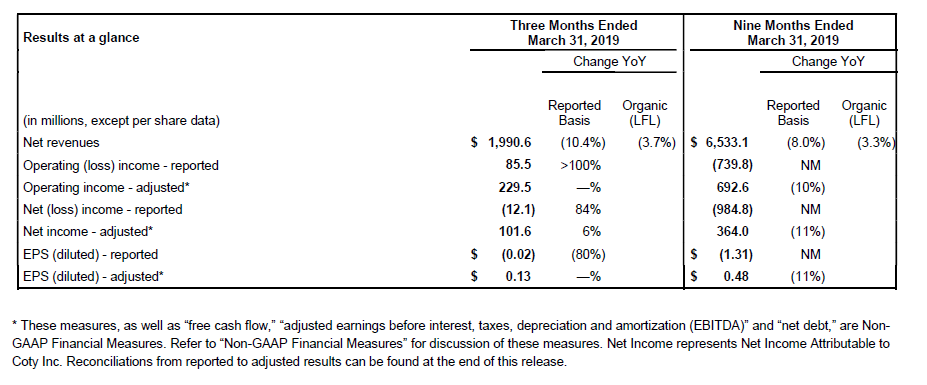
- 3Q19 reported net revenues of $1,990.6 million decreased 10.4% year-over-year, with a like-for-like (LFL) revenue decrease of 3.7%. This LFL decline reflected two temporary factors: (i) changes in revenue recognition accounting, which reversed to a negative impact in 3Q19 from a positive impact in 2Q19; and (ii) moderate supply chain related headwinds.
- We estimate that these two factors together negatively impacted LFL revenues by approximately 2%. This performance reflects solid LFL growth in Luxury, a slightly negative performance in Professional Beauty, and a 10% decline in Consumer Beauty, with the latter including approximately 3% of headwinds from the temporary factors.
- During the quarter, we largely resolved the supply constraints across all divisions, resulting in a significant reduction in supply chain-related headwinds in 3Q19 and a minimal expected impact in 4Q19. Year-to-date, we estimate the supply chain disruptions negatively impacted net revenues by over $150 million.
- Year-to-date reported net revenues of $6,533.1 million decreased by 8.0%, with a LFL revenue decline of 3.3%. We estimate that the year-to-date negative impact of the temporary factors cited above was over 2%.
Gross Margin
- 3Q19 reported gross margin of 62.8% decreased by 70 bps from the prior-year period, while the adjusted gross margin of 62.9% decreased by 140 bps, as margin expansion in Luxury and Professional Beauty was more than offset by margin contraction in Consumer Beauty, reflecting the negative impact from the change in revenue recognition accounting, adverse regional mix and margin weakness at Younique.
- Year-to-date reported gross margin of 61.6% decreased 20 bps from the prior-year, while the adjusted gross margin of 61.8% decreased by 60 bps, driven primarily by the supply chain disruptions in YTD19.
Operating Income:
- 3Q19 reported operating income of $85.5 million increased versus 3Q18 reported operating income of $20.7 million, supported by lower restructuring charges and good control of SG&A costs.
- 3Q19 adjusted operating income of $229.5 million was in line with the prior year, despite foreign exchange headwinds of approximately 5%. The adjusted operating margin of 11.5% increased 120 bps from the prior-year period. The stable year-over-year profit performance reflects strong fixed cost control, lower stock compensation, lower A&CP spending tied to reductions in non-working media and transactional FX benefits, all of which offset the profit impact from the lower top-line result.
- 3Q19 adjusted operating income was also impacted by the temporary revenue recognition and supply chain headwinds cited above. We estimate that the cumulative negative impact from these factors in 3Q19 was approximately $30 million.
- Year-to-date reported operating loss of $739.8 million compared to reported operating income of $225.4 million in the prior year, reflecting a $965.1 million non-cash impairment charge taken in 2Q19 primarily connected to the Consumer Beauty division and select trademarks.
- Year-to-date adjusted operating income of $692.6 million declined by 10% from the prior year including foreign exchange headwinds of approximately 4%, with an adjusted operating margin of 10.6%. We estimate that year-to-date adjusted operating income was adversely impacted by temporary factors of approximately $105 million, including approximately $100 million from the supply chain disruptions. On a constant currency basis, year-to-date adjusted operating income totaled $723.8 million.
Net Income:
- 3Q19 reported net loss of $12.1 million compared to reported net loss of $77.0 million in the prior-year period driven by an improved reported operating income, while the adjusted net income of $101.6 million grew by 6%, reflecting stable adjusted pre-tax income and a decline in our redeemable non-controlling interest as compared to the prior-year period.
- Year-to-date reported net loss of $984.8 million compared to reported net income of $12.5 million in the prior-year driven by the 2Q19 impairment charge, while the adjusted net income of $364.0 million decreased 11% driven by the adjusted operating income decline.
Earnings Per Share (EPS):
- 3Q19 reported earnings per share of $(0.02) improved from $(0.10) in the prior year period, and the adjusted EPS of $0.13 was flat with the prior year period.
- Year-to-date reported earnings per share of $(1.31) declined from $0.02 in the prior-year as a result of the aforementioned impairment charge, and adjusted EPS of $0.48 declined from $0.54 in the prior year.
Operating Cash Flow & Net Debt:
- In 3Q19, net cash provided by operating activities was $213.7 million, a $332.6 million improvement from the prior year period net cash used in operations of $118.9 million. This operating cash flow improvement reflected the impact of working capital management initiatives, including a solid improvement in the aging of our underlying receivables and the contribution of approximately $110 million from a receivables factoring program. Year-to-date operating cash flow totaled $451.4 million, an increase of $262.5 million from the same period of the prior year.
- Our 3Q19 free cash flow of $142.1 million improved by $347.5 million from the prior year period, fueled by the operating cash flow increase and a $14.9 million decline in capex. Year-to-date free cash flow of $120.5 million increased from a free cash flow use of $129.8 million in the prior year, driven by the increased operating cash flow in 3Q19.
Dividend and Net Debt:
- On May 8, 2019, Coty announced a dividend of $0.125 per share payable on June 28, 2019 to holders of record on June 6, 2019. This dividend will be considered a taxable dividend.
- Consistent with our objective of deleveraging to below 4.0x Net Debt/Adjusted EBITDA, Coty is initiating a stock dividend reinvestment program giving shareholders the option to receive their full dividend in cash or to receive their dividend in 50% cash / 50% common stock. Shareholders will be able to make this election on a quarterly basis, beginning with the June 2019 dividend payment, for which the election deadline is June 20, 2019. JAB Group, Coty’s largest shareholder, has informed us that it will elect to receive 50% of its dividend in common stock, until Coty has reached its targeted leverage.
- Net debt of $7,388.2 million on March 31, 2019 decreased by $100.3 million from the balance of $7,488.5 million on December 31, 2018 driven by positive free cash flow and a benefit from foreign exchange. This resulted in a last twelve months Net debt to adjusted EBITDA ratio of 5.7x, a slight improvement over the 5.8x reported ratio on December 31, 2018.
Management Comments
Commenting on the operating results, Pierre Laubies, Coty CEO said:
"The close of the third quarter comes only a few months after the new senior management team has been put into place, and I'm very pleased with how the new management team has coalesced. Third quarter results clearly indicate that supply issues are largely resolved and we expect very limited impact from supply chain disruption on the business in the remainder of fiscal 2019. Performance this quarter also shows the increased control that we now have over our cost structure, both in terms of general and administrative costs as well as proactive management of non-working A&CP. Taken together, these factors have allowed us to deliver solid adjusted operating income in-line with the expectations we laid out last quarter. Thus, while we have achieved good profit delivery, the weak top-line result demonstrates that there is still much to be done to turnaround the business. We must capitalize on the solid results of the Luxury and Professional Beauty divisions, and address the weakness of the Consumer Beauty division's performance via shelf productivity, product range simplification, and brand investment at scale. These are the main priorities of the strategic plan that we are completing and which we will start deploying as soon as fiscal 2020. We are more than ever convinced that the core business principles, which were outlined on the second quarter earnings call, are the most relevant levers to maximize value creation in the short and medium term."
Commenting on the financials, Pierre-Andre Terisse, Coty CFO said:
"Alongside the solid profit result, we achieved positive free cash flow in both the quarter and year-to-date, which reflects increased focus and prioritization in the business. As a result, we ended the quarter with our leverage under control. Having been immersed in the business for several months and deeply involved in the formulation of the strategic plan, I would like to confirm that, in the medium term, we are targeting a net debt to adjusted EBITDA ratio of less than 4 times, which will be achieved through a combination of EBITDA growth and net debt paydown. Consistent with this objective, Coty will maintain our quarterly dividend of $0.125 per share and initiate a stock dividend reinvestment program giving shareholders the option to receive dividends fully in cash or in a combination of 50% cash and 50% common stock. JAB has informed us that it will elect to receive its dividend in stock for half of its holdings until Coty has reached its medium term targeted leverage. We are also pleased with the successful completion of the Tender Offer in recent days and the transaction's underlying expression of confidence and support in Coty from JAB.”
Outlook
We continue to expect that FY19 constant currency adjusted operating income will be moderately below FY18, implying a solid profit performance in the fourth quarter, despite expected continued weakness in top-line. We continue to expect positive free cash flow for FY19, with solid free cash flow generation in 4Q19.
Third Quarter Fiscal 2019 Business Review by Segment
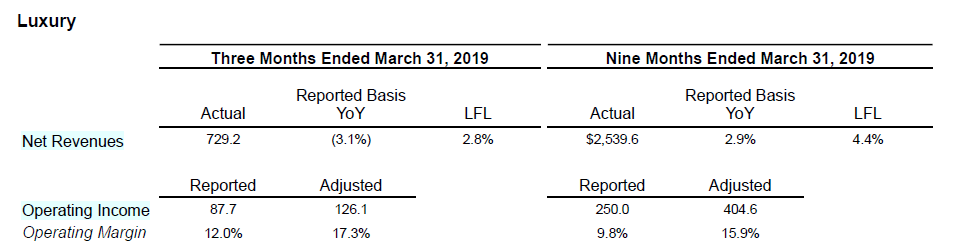
In 3Q19, reported Luxury net revenues of $729.2 million decreased by 3.1% versus the prior year. On a LFL basis, Luxury net revenues increased by 2.8%. We estimate that the required revenue recognition accounting change and supply chain disruptions negatively impacted revenues by approximately 1%.
Solid 3Q19 results were supported by continued strength in Burberry, Gucci and Calvin Klein, and the return to strong growth in Hugo Boss as the supply chain disruptions abated and the brand saw momentum behind the launch of Boss Bottled Infinite. The continued sell-out strength of Chloé Nomade and Marc Jacobs' Daisy drove sustained share gains for both brands. We recently announced the renewal of the Marc Jacobs fragrance license, reinforcing the strength and longevity of the Luxury brand portfolio. We also recently launched our new Gucci lipstick collection, which features a wide range of shades and finishes, and represents the first step in our re-launch of the Gucci make-up line.
The Luxury division delivered reported operating income of $87.7 million, an increase of 48% vs. the prior-year period. 3Q19 adjusted operating income was $126.1 million, reflecting very strong 26% growth from the prior year, driven by solid fixed cost reductions, cost of sales savings resulting from the supply chain integration programs and streamlining of non-working A&CP. The 3Q19 adjusted operating margin was 17.3%, an increase of 400 bps versus 3Q18. Despite close to $50 million in profit impact from supply chain disruptions and $12 million FX translation impact, the year-to-date Luxury adjusted operating income grew 28.2%, resulting in a 310 bps margin improvement to 15.9%.
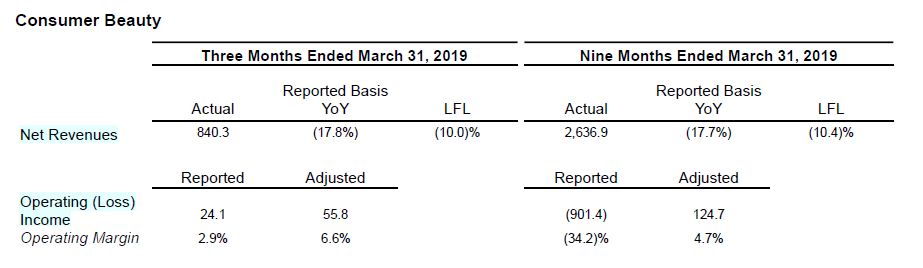
3Q19 Consumer Beauty net revenues of $840.3 million declined 17.8% on a reported basis and declined 10.0% LFL. We estimate that the required revenue recognition policy change and supply chain disruptions impacted revenues by approximately 3%. Excluding these temporary factors, this performance continues to be broadly in-line with sell-out trends, which are declining high single digits as our brands face share losses and continued weakness in the global mass beauty category, particularly in the U.S. and Europe.
By category, and adjusting for negative impact of the revenue recognition accounting change, net revenue in color cosmetics declined high single digits and was consistent with the retail performance. Sell-out in Cover Girl, Rimmel and Max Factor cosmetics brands was in line with our category average, while Sally Hansen delivered low single digit sell-out growth and share gains in the U.S. Net revenues in retail hair also declined high single digits, though sell-out performance was strong in ALMEA and Wella Retail gained share across multiple markets. Body care revenues improved year over year as we lapped an easy comparable from 3Q18 when body care net revenues were temporarily depressed as a result of our pricing intervention in Brazil, which significantly impacted shipments of Brazil local body care brands. During the quarter, we saw solid share gains in both Brazil local brands and the adidas body care portfolio.
Younique revenues and profit declined during 3Q19 driven by lower presenter sponsorship, although Younique's customizable skincare line, YOU·OLOGY, was launched during the quarter and is off to a solid start.
Reported operating loss in 3Q19 of $24.1 million compared to reported operating income of $64.2 million in the prior year period. The 3Q19 adjusted operating income of $55.8 million declined from $97.3 million in the prior year period, resulting in an adjusted operating margin of 6.6%. Despite reductions in fixed costs, the adjusted operating margin was impacted by net revenue contraction and gross margin pressure, driven by both the negative impact from the change in accounting for revenue recognition and regional mix linked to Brazil.
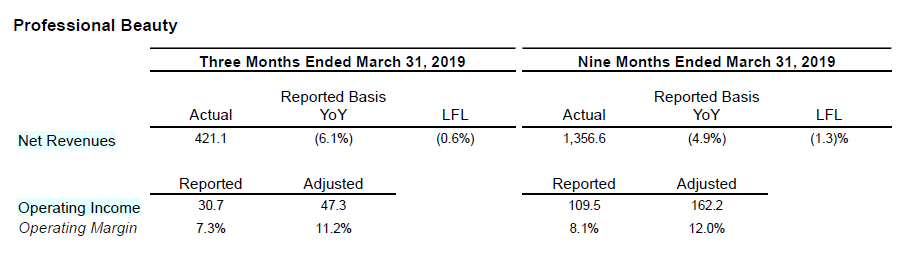
Professional Beauty 3Q19 net revenues of $421.1 million declined by 6.1%, with LFL down 0.6%, including minor impact from both supply chain and the revenue recognition accounting change. The modest decline was driven by weakness in North America, due to lingering impacts from Coty's supply chain disruptions, and trade inventory reductions at certain key customers. With service levels now largely restored for OPI, the brand returned to solid growth, and we continued to enjoy very strong momentum in ghd due to the product launch of the ghd Glide hot-brush in the quarter and the continued success of the Platinum+ styler.
Professional Beauty reported operating income of $30.7 million increased from $11.4 million in the prior year period, while adjusted operating income grew 57% to $47.3 million. The Professional Beauty division adjusted operating margin of 11.2% grew 450 bps, driven by strong gross margin performance and good fixed cost reduction. Despite over $20 million in profit impact from supply chain disruptions and $8 million negative FX impact, the year-to-date Professional Beauty adjusted operating income grew 18.2%, resulting in 240 bps margin improvement to 12.0%.
Third Quarter Fiscal 2019 Business Review by Geographic Region
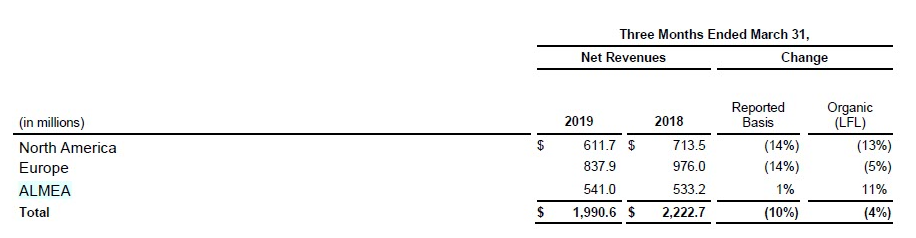
North America
- North America net revenues of $611.7 million, or approximately 31% of total net revenues, declined 14% as reported and declined 13% LFL. The revenue recognition accounting change, which primarily affected North America, negatively impacted net revenues by approximately 3%. The overall decline was driven by weakness in Consumer Beauty, reflecting underlying mass beauty market challenges, shelf space losses in several brands, and pressure on Younique. Professional Beauty net revenues were lower as a result of certain key customers' trade inventory reduction and lingering impacts from the supply chain disruptions.
Europe
- Europe net revenues of $837.9 million, or approximately 42% of total net revenues, declined 14% on a reported basis and declined 5% on a LFL basis driven by weakness in Consumer Beauty as a result of performance challenges, largely offset by growth in Luxury fueled by Germany, UK, and Spain, and growth in Professional Beauty, particularly in the U.K. and Russia.
ALMEA
- ALMEA net revenues of $541.0 million, or approximately 27% of total net revenues, increased 1% as reported, and grew a very strong 11% LFL driven by Consumer Beauty, primarily as a result of favorable comparables in Brazil, and strong growth in Luxury on the back of robust performance China and the Middle East.
Cash Flows
- In 3Q19, net cash provided by operating activities was $213.7 million, a $332.6 million improvement from the prior year period net cash used in operations of $118.9 million. This operating cash flow improvement reflected the impact of working capital management initiatives, including the contribution of approximately $110 million from a receivables factoring program and a solid improvement in the aging of our underlying receivables. Year-to-date operating cash flow totaled $451.4 million, an increase of $262.5 million from the same period of the prior year.
- Our 3Q19 free cash flow of $142.1 million improved by $347.5 million from the prior year period, fueled by the operating cash flow increase and a $14.9 million decline in capex. Year-to-date free cash flow of $120.5 million increased from a free cash flow use of $129.8 million in the prior year, driven by the increased operating cash flow in 3Q19.
- In 3Q19, we distributed $94.4 million in quarterly dividends for a cumulative total of $282.8 million.
- Cash and cash equivalents of $384.1 million decreased modestly from $417.5 million on December 31, 2018. Total debt of $7,772.3 million decreased by $133.7 million from December 31, 2018, with net debt of $7,388.2 million, a decrease of $100.3 million from the balance of $7,488.5 million on December 31, 2018. This net debt decrease reflects positive free cash flow and a benefit from foreign exchange, as well as the payment of $94.4 million of dividends.
Other Company Developments
Other company developments include:
- On February 13, 2019, JAB Holding Company S.à r.l. commenced its Tender Offer, pursuant to which an affiliate of JAB Group would acquire up to 150 million additional shares of Coty's Class A common stock at a price of $11.65 per share in cash. This Tender Offer was completed on April 30, 2019, with JAB Group's ownership of Coty now accounting for 60% of our outstanding shares.
Conference Call
Coty Inc. will host a conference call at 8:00 a.m. (ET) today, May 8, 2019 to discuss its results. The dial-in number for the call is (866) 834-4311 in the U.S. or (720) 405-2213 internationally (conference passcode number: 2479048). The live audio webcast and presentation slides will be available at http://investors.coty.com. The conference call will be available for replay.
About Coty Inc.
Coty is one of the world’s largest beauty companies with over $9 billion in revenue, an iconic portfolio of brands and a purpose to celebrate and liberate the diversity of consumers’ beauty. We believe the beauty of humanity lies in the individuality of its people; beauty is at its best when authentic; and beauty should make you feel happy, never sad. As the global leader in fragrance, a strong number two in professional salon hair color & styling, and number three in color cosmetics, Coty operates three divisions: Consumer Beauty, which is focused on mass color cosmetics, mass retail hair coloring and styling products, body care and mass fragrances with brands such as COVERGIRL, Max Factor, Bourjois and Rimmel; Luxury, which is focused on prestige fragrances and skincare with brands such as Calvin Klein, Marc Jacobs, Hugo Boss, Gucci and philosophy; and Professional Beauty, which is focused on servicing salon owners and professionals in both hair and nail, with brands such as Wella Professionals, Sebastian Professional, OPI and ghd. Coty has 20,000 colleagues globally and its products are sold in over 150 countries. Coty and its brands are committed to a range of social causes as well as seeking to minimize its impact on the environment.
For additional information about Coty Inc., please visit www.coty.com.
Forward Looking Statements
Certain statements in this Earnings Release are “forward-looking statements” within the meaning of the Private Securities Litigation Reform Act of 1995. These forward-looking statements reflect our current views with respect to, among other things, the Company's strategic planning, the Company’s targets and outlook for future reporting periods (including the extent and timing of revenue and profit trends and the Consumer Beauty division’s stabilization), the Company's future operations and strategy, synergies, savings, performance, cost, timing and integration relating to our recent acquisitions (including The Procter & Gamble Company’s beauty business (the “P&G Beauty Business”)), ongoing and future cost efficiency and restructuring initiatives and programs (including timing and impact), strategic transactions (including mergers and acquisitions, joint ventures, investments, divestitures, licenses and portfolio rationalizations), FY19 adjusted operating income, positive free cash flow and liquidity, future effective tax rates, timing and size of cash outflows and debt deleveraging, and impact and timing of supply chain disruptions and resolution thereof, finalization of a strategic plan and the anticipated priorities of the Company's new senior management, the dividend reinvestment program, and the future impact of U.S. tax laws including the base erosion anti-abuse tax and the global low-taxed income rules. These forward-looking statements are generally identified by words or phrases, such as “anticipate”, “are going to”, “estimate”, “plan”, “project”, “expect”, “believe”, “intend”, “foresee”, “forecast”, “will”, “may”, “should”, “outlook”, “continue”, “temporary”, “target”, “aim”, “potential” and similar words or phrases. These statements are based on certain assumptions and estimates that we consider reasonable, but are subject to a number of risks and uncertainties, many of which are beyond our control, which could cause actual events or results (including our financial condition, results of operations, cash flows and prospects) to differ materially from such statements, including:
- the Company’s ability to develop and achieve its global business strategies, compete effectively in the beauty industry and achieve the benefits contemplated by its strategic initiatives within the expected time frame or at all;
- the Company’s ability to anticipate, gauge and respond to market trends and consumer preferences, which may change rapidly, and the market acceptance of new products, including any relaunched or rebranded products, execution of new launches, and the anticipated costs and discounting associated with such relaunches and rebrands, and consumer receptiveness to its marketing and consumer engagement activities (including digital marketing and media);
- use of estimates and assumptions in preparing the Company’s financial statements, including with regard to revenue recognition, stock compensation expense, income taxes, the assessment of goodwill and other intangible and long-lived assets for impairments, the market value of inventory, pension expense and the fair value of acquired assets and liabilities associated with acquisitions;
- the impact of any future impairments;
- managerial, integration, operational, regulatory, legal and financial risks, including diversion of management attention to and management of, cash flows, expenses and costs associated with multiple ongoing and future strategic initiatives, internal reorganizations;
- the continued integration of the P&G Beauty Business and other recent acquisitions with the Company's business, operations, systems, financial data and culture and the ability to realize synergies, avoid future supply chain and other business disruptions, reduce costs (including through the Company's cash efficiency initiatives) and realize other potential efficiencies and benefits (including through the Company's restructuring initiatives) at the levels and at the costs and within the time frames contemplated or at all;
- increased competition, consolidation among retailers, shifts in consumers’ preferred distribution and marketing channels (including to digital and luxury channels), distribution and shelf-space resets or reductions, compression of go-to-market cycles, changes in product and marketing requirements by retailers, reductions in retailer inventory levels and order lead-times or changes in purchasing patterns, and other changes in the retail, e-commerce and wholesale environment in which the Company does business and sells its products and the Company's ability to respond to such changes;
- the Company and its business partners' and licensors' abilities to obtain, maintain and protect the intellectual property used in its and their respective businesses, protect its and their respective reputations (including those of its and their executives or influencers), public goodwill, and defend claims by third parties for infringement of intellectual property rights;
- any change to the Company's capital allocation and/or cash management priorities;
- any unanticipated problems, liabilities or other challenges associated with an acquired business which could result in increased risk or new, unanticipated or unknown liabilities, including with respect to environmental, competition and other regulatory, compliance or legal matters;
- the Company’s international operations and joint ventures, including enforceability and effectiveness of its joint venture agreements and reputational, compliance, regulatory, economic and foreign political risks, including difficulties and costs associated with maintaining compliance with a broad variety of complex local and international regulations;
- the Company's dependence on certain licenses (especially in its Luxury division) and the Company's ability to renew expiring licenses on favorable terms or at all;
- the Company's dependence on entities performing outsourced functions, including outsourcing of distribution functions, third-party manufacturers, logistics and supply chain suppliers, and other suppliers, including third-party software providers;
- administrative, development and other difficulties in meeting the expected timing of market expansions, product launches and marketing efforts;
- global political and/or economic uncertainties, disruptions or major regulatory or policy changes, and/or the enforcement thereof that affect our business, financial performance, operations or products, including the impact of Brexit, the current U.S. administration, the results of elections in European countries and in Brazil, changes in the U.S. tax code and recent changes and future changes in tariffs, retaliatory or trade protection measures, trade policies and other international trade regulations in the U.S. and in other regions where the Company operates including the European Union and China;
- currency exchange rate volatility and currency devaluation;
- the number, type, outcomes (by judgment, order or settlement) and costs of any current or future legal, compliance, tax, regulatory or administrative proceedings, investigations and/or litigation, including litigation relating to the tender offer by Cottage Holdco B.V. (the "Offer");
- the Company’s ability to manage seasonal factors and other variability and to anticipate future business trends and needs;
- disruptions in operations and sales, including due to disruptions in supply chain, logistics, restructurings and other business alignment activities, manufacturing or information technology systems, labor disputes, extreme weather and natural disasters, and the impact of such disruptions on the Company's ability to generate profits, stabilize or grow revenues or cash flows, comply with its contractual obligations and accurately forecast demand and supply needs and/or future results;
- restrictions imposed on the Company through its license agreements, credit facilities and senior unsecured bonds or other material contracts, its ability to generate cash flow to repay, refinance or recapitalize debt and otherwise comply with its debt instruments, and changes in the manner in which the Company finances its debt and future capital needs;
- increasing dependency on information technology and the Company’s ability to protect against service interruptions, data corruption, cyber-based attacks or network security breaches, costs and timing of implementation and effectiveness of any upgrades or other changes to information technology systems, including the Company's digital transformation initiatives, and the cost of compliance or the Company's failure to comply with any privacy or data security laws (including the European Union General Data Protection Regulation or to protect against theft of customer, employee and corporate sensitive information;
- the Company's ability to attract and retain key personnel and the impact of the recent senior management transitions;
- the distribution and sale by third parties of counterfeit and/or gray market versions of the Company’s products; and
- the results and impact of the Company's ongoing strategic review and the creation, revision and implementation of the Company's strategic plan;
- the impact of the Offer on the Company's relationships with key customers and suppliers and certain material contracts;
- the Company's relationship with Cottage Holdco B.V., as the Company's majority stockholder, and its affiliates, and any related conflicts of interest or litigation
- future sales of a significant number of shares in the public market by the Company's majority stockholder or contractually by certain commercial banks on behalf of the Company's majority stockholder, as may be required to satisfy any potential future credit difficulties in connection with such majority stockholder's credit agreement, or the perception that such sales could occur.
- other factors described elsewhere in this document and from time to time in documents that the Company file with the SEC.
When used herein, the term “includes” and “including” means, unless the context otherwise indicates, “including without limitation”. More information about potential risks and uncertainties that could affect the Company’s business and financial results is included under the heading “Risk Factors” and “Management’s Discussion and Analysis of Financial Condition and Results of Operations” in the Company’s Annual Report on Form 10-K for the fiscal year ended June 30, 2018 and other periodic reports the Company has filed and may file with the SEC from time to time.
All forward-looking statements made in this release are qualified by these cautionary statements. These forward-looking statements are made only as of the date of this release, and the Company does not undertake any obligation, other than as may be required by applicable law, to update or revise any forward-looking or cautionary statements to reflect changes in assumptions, the occurrence of events, unanticipated or otherwise, or changes in future operating results over time or otherwise.
Comparisons of results for current and any prior periods are not intended to express any future trends or indications of future performance unless expressed as such, and should only be viewed as historical data.
Non-GAAP Financial Measures
The Company operates on a global basis, with the majority of net revenues generated outside of the U.S. Accordingly, fluctuations in foreign currency exchange rates can affect results of operations. Therefore, to supplement financial results presented in accordance with GAAP, certain financial information is presented excluding the impact of foreign currency exchange translations to provide a framework for assessing how the underlying businesses performed excluding the impact of foreign currency exchange translations (“constant currency”). Constant currency information compares results between periods as if exchange rates had remained constant period-over-period, with the current period’s results calculated at the prior-year period’s rates. The Company calculates constant currency information by translating current and prior-period results for entities reporting in currencies other than U.S. dollars into U.S. dollars using constant foreign currency exchange rates. The constant currency calculations do not adjust for the impact of revaluing specific transactions denominated in a currency that is different to the functional currency of that entity when exchange rates fluctuate. The constant currency information presented may not be comparable to similarly titled measures reported by other companies. The Company discloses the following constant currency financial measures: net revenues, organic like-for-like (LFL) net revenues, adjusted gross profit and adjusted operating income.
The Company presents period-over-period comparisons of net revenues on a constant currency basis as well as on an organic (LFL) basis. The Company believes that organic (LFL) better enables management and investors to analyze and compare the Company's net revenues performance from period to period. For the period described in this release, the term “like-for-like” describes the Company's core operating performance, excluding the financial impact of (i) acquired brands or businesses in the current year period until we have twelve months of comparable financial results, (ii) divested brands or businesses or early terminated brands in the prior year period to maintain comparable financial results with the current fiscal year period and (iii) foreign currency exchange translations to the extent applicable. For a reconciliation of organic (LFL) period-over-period, see the table entitled “Reconciliation of Reported Net Revenues to Like-For-Like Net Revenues”.
The Company presents operating income, operating income margin, gross profit, gross margin, effective tax rate, net income, net income margin, net revenues and EPS (diluted) on a non-GAAP basis and specifies that these measures are non-GAAP by using the term “adjusted”. The Company believes these non-GAAP financial measures better enable management and investors to analyze and compare operating performance from period to period. In calculating adjusted operating income, operating income margin, gross profit, gross margin, effective tax rate, net income, net income margin and EPS (diluted), the Company excludes the following items:
- Costs related to acquisition activities: The Company excludes acquisition-related costs and acquisition accounting impacts such as those related to transaction costs and costs associated with the revaluation of acquired inventory in connection with business combinations because these costs are unique to each transaction. The nature and amount of such costs vary significantly based on the size and timing of the acquisitions and the maturities of the businesses being acquired. Also, the size, complexity and/or volume of past acquisitions, which often drives the magnitude of such expenses, may not be indicative of the size, complexity and/or volume of any future acquisitions.
- Restructuring and other business realignment costs: The Company excludes costs associated with restructuring and business structure realignment programs to allow for comparable financial results to historical operations and forward-looking guidance. In addition, the nature and amount of such charges vary significantly based on the size and timing of the programs. By excluding the above referenced expenses from the non-GAAP financial measures, management is able to evaluate the Company’s ability to utilize existing assets and estimate their long-term value. Furthermore, management believes that the adjustment of these items supplement the GAAP information with a measure that can be used to assess the sustainability of the Company’s operating performance.
- Asset impairment charges: We have excluded the impact of asset impairments as such non-cash amounts are inconsistent in amount and frequency and are significantly impacted by the timing and/or size of acquisitions. Our management believes that the adjustment of these items supplement the GAAP information with a measure that can be used to assess the sustainability of our operating performance.
- Amortization expense: The Company excludes the impact of amortization of finite-lived intangible assets, as such non-cash amounts are inconsistent in amount and frequency and are significantly impacted by the timing and/or size of acquisitions. Management believes that the adjustment of these items supplement the GAAP information with a measure that can be used to assess the sustainability of the Company’s operating performance. Although the Company excludes amortization of intangible assets from the non-GAAP expenses, management believes that it is important for investors to understand that such intangible assets contribute to revenue generation. Amortization of intangible assets that relate to past acquisitions will recur in future periods until such intangible assets have been fully amortized. Any future acquisitions may result in the amortization of additional intangible assets.
- Other (income) expense: We have excluded the impact of costs incurred for legal and advisory services rendered in connection with the evaluation of the tender offer initiated on February 13, 2019 by certain of our shareholders. Our management believes these costs do not reflect our underlying ongoing business, and the adjustment of such costs helps investors and others compare and analyze performance from period to period.
- Loss on early extinguishment of debt: We have excluded loss on extinguishment of debt as this represents a non-cash charge, and the amount and frequency of such charges is not consistent and is significantly impacted by the timing and size of debt financing transactions.
- Noncontrolling interest: This adjustment represents the after-tax impact of the non-GAAP adjustments included in Net income attributable to noncontrolling interests based on the relevant non-controlling interest percentage.
- Tax: This adjustment represents the impact of the tax effect of the pretax items excluded from Adjusted net income. The tax impact of the non-GAAP adjustments are based on the tax rates related to the jurisdiction in which the adjusted items are received or incurred.
The estimated supply chain impact to adjusted operating income only includes the direct impact on net revenues and the associated impact on cost of sales, while the Company assumed no impact from any other operating expenses.
The Company has provided a quantitative reconciliation of the difference between the non-GAAP financial measures and the financial measures calculated and reported in accordance with GAAP. For a reconciliation of adjusted gross profit to gross profit, adjusted EPS (diluted) to EPS (diluted), and adjusted net revenues to net revenues, see the table entitled “Reconciliation of Reported to Adjusted Results for the Consolidated Statements of Operations.” For a reconciliation of adjusted operating income to operating income and adjusted operating income margin to operating income margin, see the tables entitled “Reconciliation of Reported Operating Income (Loss) to Adjusted Operating Income” and "Reconciliation of Reported Operating Income (Loss) to Adjusted Operating Income by Segment." For a reconciliation of adjusted effective tax rate and adjusted cash tax rate to effective tax rate, see the table entitled “Reconciliation of Reported (Loss) Income Before Income Taxes and Effective Tax Rates to Adjusted Income Before Income Taxes, Effective Tax Rates and Cash Tax Rates.” For a reconciliation of adjusted net income and adjusted net income margin to net income (loss), see the table entitled “Reconciliation of Reported Net Income to Adjusted Net Income.”
The Company also presents free cash flow, adjusted EBITDA and net debt. Management believes that these measures are useful for investors because it provides them with an important perspective on the cash available for debt repayment and other strategic measures and provides them with the same measures that management uses as the basis for making resource allocation decisions. Free cash flow is defined as net cash provided by operating activities, less capital expenditures, adjusted EBITDA is defined as adjusted operating income less depreciation and net debt is defined as total debt less cash and cash equivalents. For a reconciliation of Free Cash Flow, see the table entitled “Reconciliation of Net Cash Provided by Operating Activities to Free Cash Flow,” for adjusted EBITDA, see the table entitled “Reconciliation of Adjusted Operating Income to Adjusted EBITDA” and for net debt, see the table entitled “Reconciliation of Total Debt to Net Debt.”
These non-GAAP measures should not be considered in isolation, or as a substitute for, or superior to, financial measures calculated in accordance with GAAP.
To the extent that the Company provides guidance, it does so only on a non-GAAP basis and does not provide reconciliations of such forward-looking non-GAAP measures to GAAP due to the inherent difficulty in forecasting and quantifying certain amounts that are necessary for such reconciliation, including adjustments that could be made for restructuring, integration and acquisition-related expenses, amortization expenses, adjustments to inventory, and other charges reflected in our reconciliation of historic numbers, the amount of which, based on historical experience, could be significant.
Additional Tables
Click here for Additional Tables.